
NSX Application Platform Part 4: Deploying the Application Platform
Completing the NSX Application Platform (NAPP) Deployment
The previous articles covered the foundation required to deploy NAPP. This article will focus primarily on achieving a successful NAPP deployment. It will include all the remaining steps required to complete the deployment, including, generating a kubeconfig file, NAPP configuration and deployment, and some troubleshooting steps along the way.
I have recently put together a video that provides clear guidance on deploying NAPP, it can be seen here.

NSX Application Platform (NAPP) // NSX Advanced Load Balancer (NSX ALB)
Understand NSX Application Platform (NAPP) architecture and how to deploy it using NSX Advanced Load...
Generating a kubeconfig File
The official instructions to generate and obtain this file are available here. This section will walk through the process outlined in the link.
- Log into the jumpbox, if you missed the configuration of the jumpbox, you can find it here.
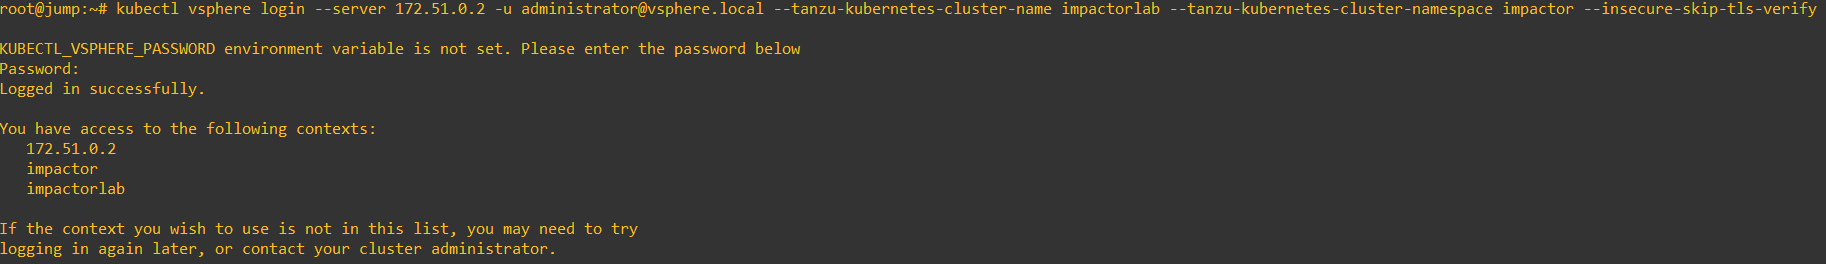
- Issue the command below to log into the guest Tanzu Guest cluster created in part 3.
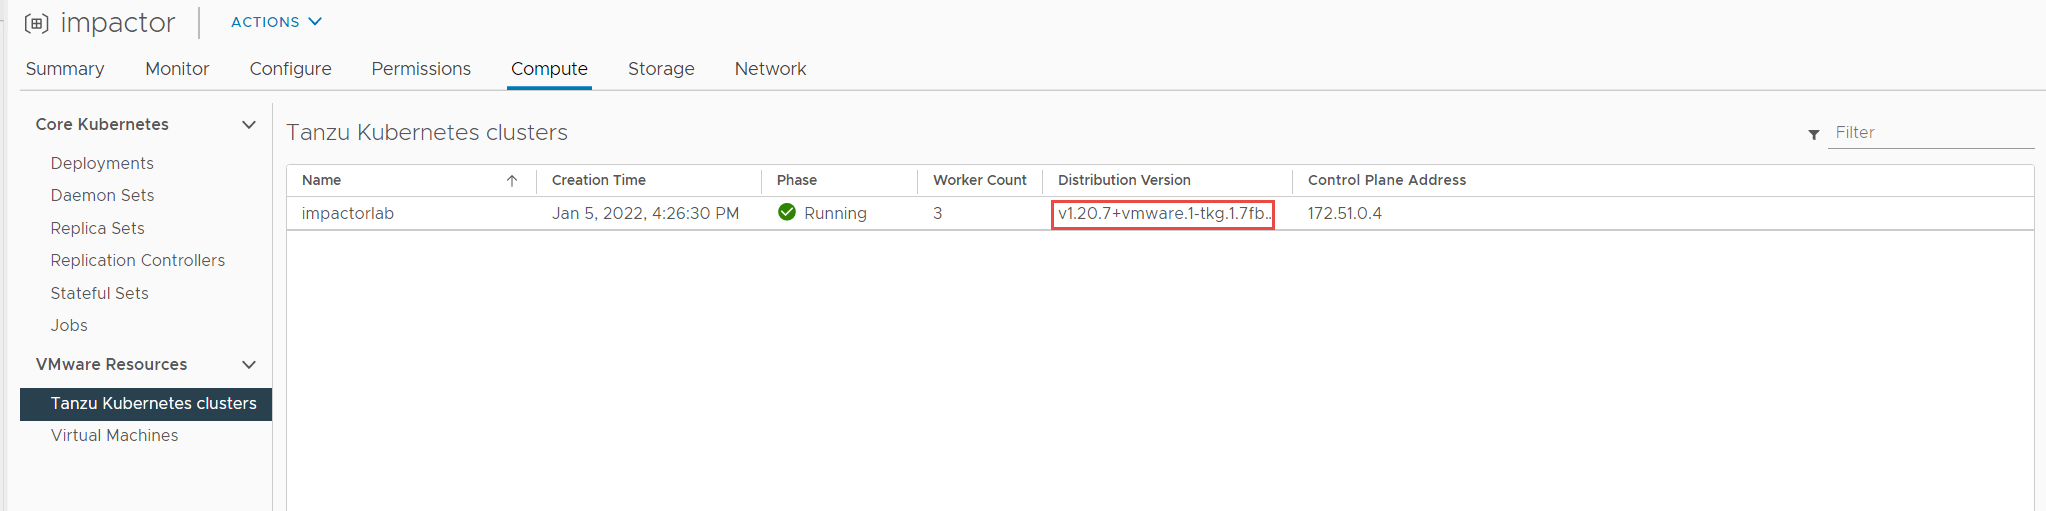
kubectl vsphere login --server 172.51.0.2 -u [email protected] --tanzu-kubernetes-cluster-name impactorlab --tanzu-kubernetes-cluster-namespace impactor --insecure-skip-tls-verifyNote: if you have installed the Tanzu cluster certificate on your jumpbox, you do not have to input “–insecure-skip-tls-verify“. This command is ignoring the certificate error. The error that you will see without it if you don’t have the certificate installed, is shown in the image below.

You should now be logged in and see a prompt similar to image below.
3. Issue the following commands to create an administrator service account and cluster role binding. I prefer to run each command individually.
kubectl create serviceaccount napp-admin -n kube-system
kubectl create clusterrolebinding napp-admin --serviceaccount=kube-system:napp-admin --clusterrole=cluster-admin
You should see something similar to the output below.

4. Next, we generate an authentication token for the service account we just created and the cluster CA. Make sure you run these commands individually as well. There will be no output from any of the commands.
SECRET=$(kubectl get serviceaccount napp-admin -n kube-system -ojsonpath='{.secrets[].name}')
TOKEN=$(kubectl get secret $SECRET -n kube-system -ojsonpath='{.data.token}' | base64 -d)
kubectl get secrets $SECRET -n kube-system -o jsonpath='{.data.ca\.crt}' | base64 -d > ./ca.crt
5. Run the commands below to obtain the Tanzu cluster URL. Once again, run these commands individually.
CONTEXT=$(kubectl config view -o jsonpath='{.current-context}')
CLUSTER=$(kubectl config view -o jsonpath='{.contexts[?(@.name == "'"$CONTEXT"'")].context.cluster}')
URL=$(kubectl config view -o jsonpath='{.clusters[?(@.name == "'"$CLUSTER"'")].cluster.server}')
6. This step generates the kubeconfig file, the filename is your choice.
TO_BE_CREATED_KUBECONFIG_FILE="<file-name>"
kubectl config --kubeconfig=$TO_BE_CREATED_KUBECONFIG_FILE set-cluster $CLUSTER --server=$URL --certificate-authority=./ca.crt --embed-certs=true
kubectl config --kubeconfig=$TO_BE_CREATED_KUBECONFIG_FILE set-credentials napp-admin --token=$TOKEN
kubectl config --kubeconfig=$TO_BE_CREATED_KUBECONFIG_FILE set-context $CONTEXT --cluster=$CLUSTER --user=napp-admin
kubectl config --kubeconfig=$TO_BE_CREATED_KUBECONFIG_FILE use-context $CONTEXT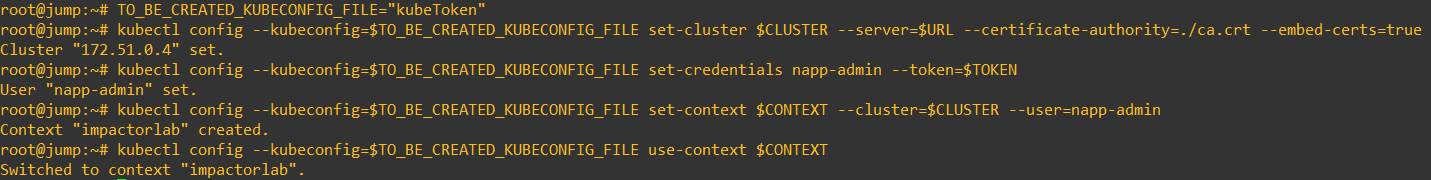
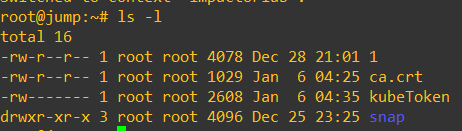
The file should now exist in the current working directory (see image below). Transfer this file to your desktop, we will need to upload it in the following section. You can also now clean up the ca.crt that was generated as part of this process.
Deploy NSX Application Platform
It’s now time to deploy the NSX Application platform, log into your NSX Manager UI, ensure it is a greenfield NSX-T 3.2 deployment.
- Once logged in, navigate to System -> NSX Application Platform. Refer to the image below.
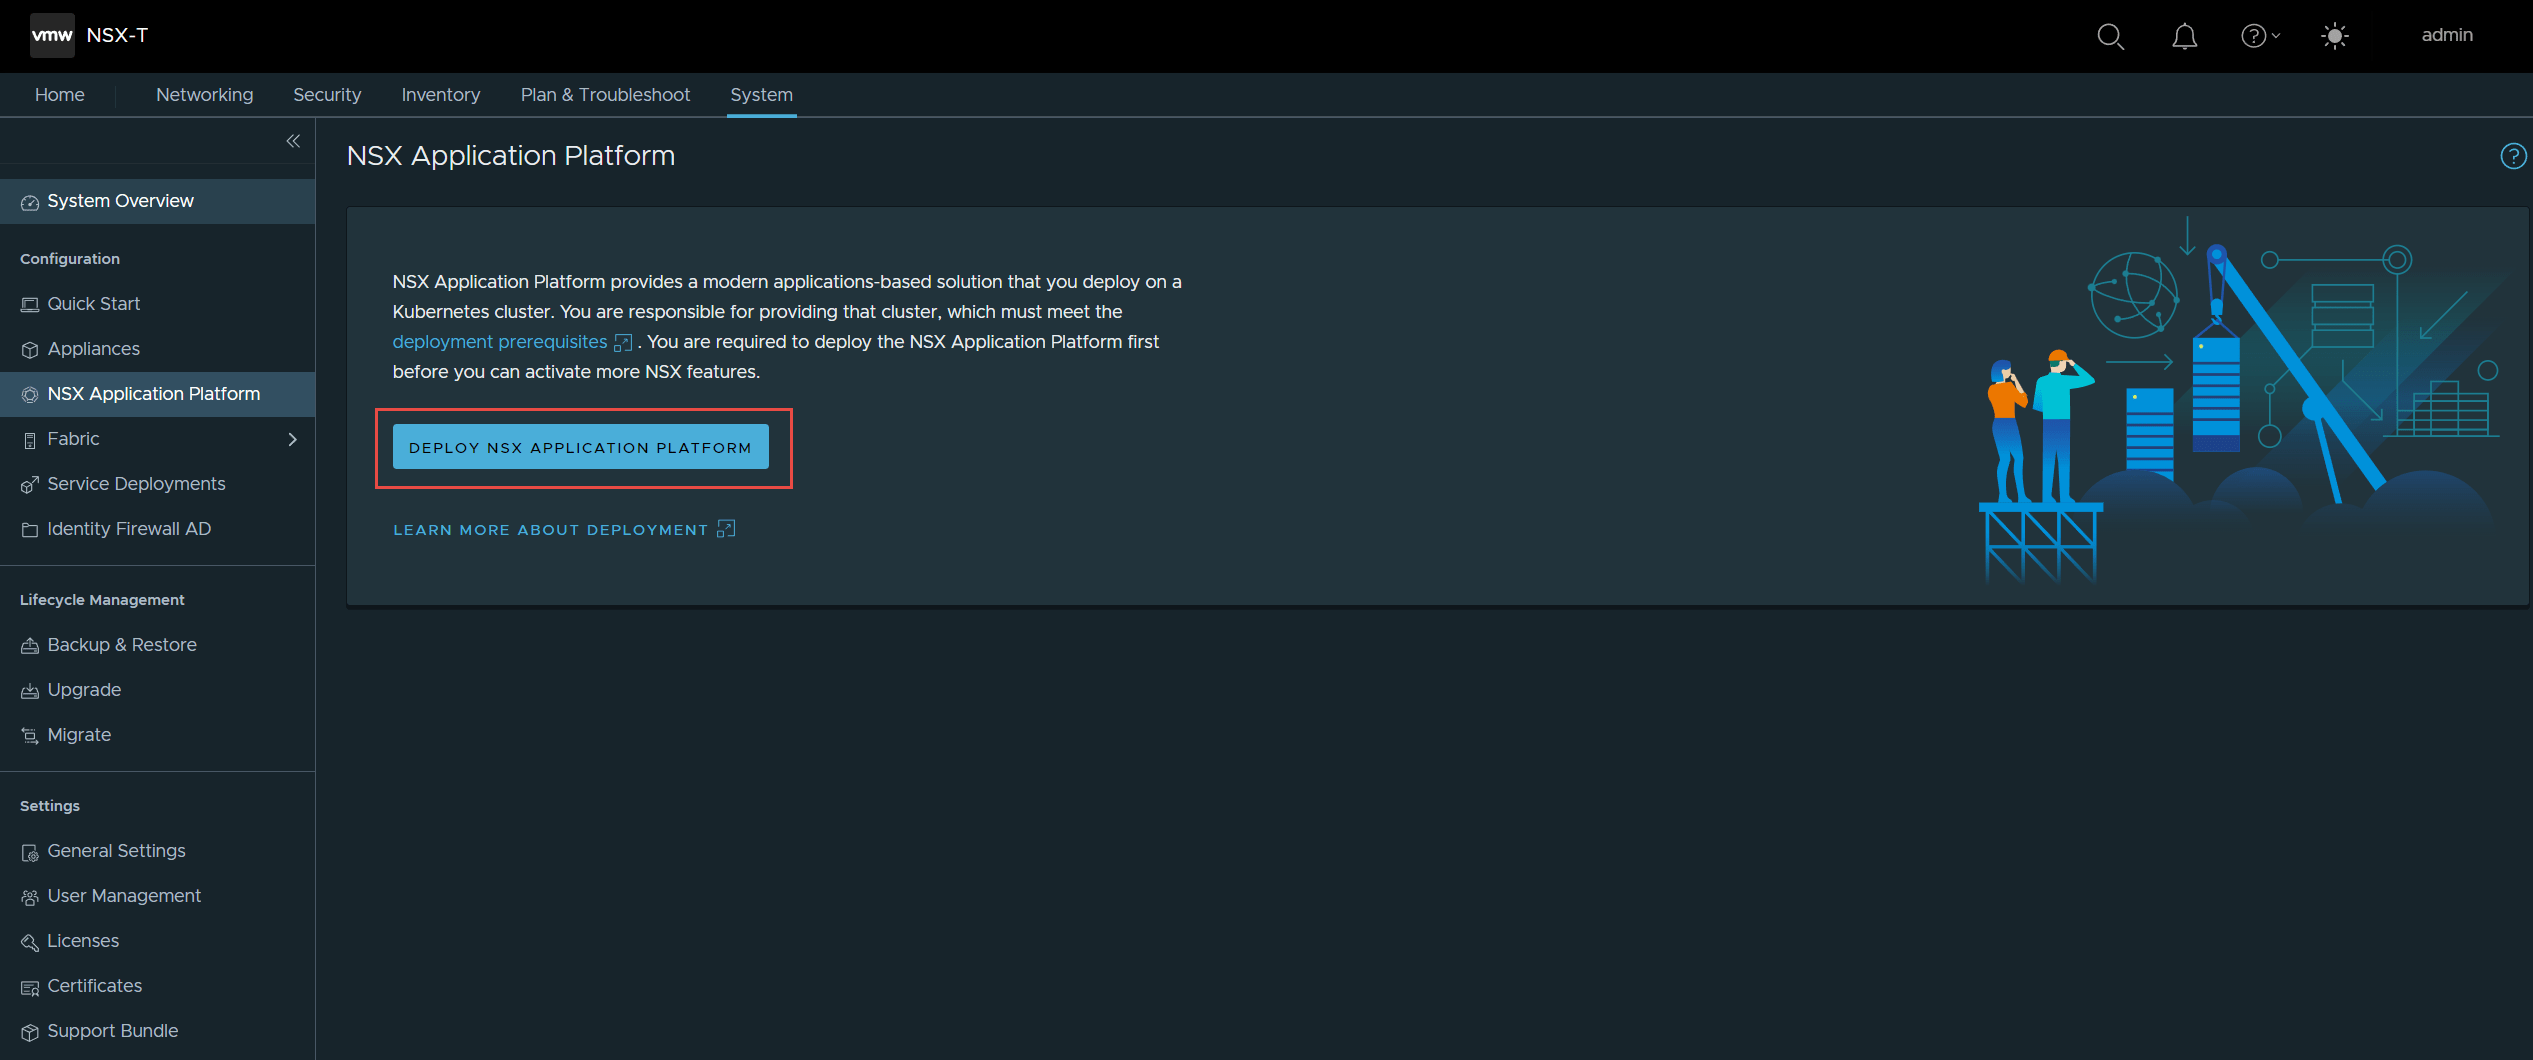
2. Click on Deploy NSX Application Platform.
3. On the next screen you are taken to the “Prepare to Deploy” page. This is where you enter your Harbor repository details.
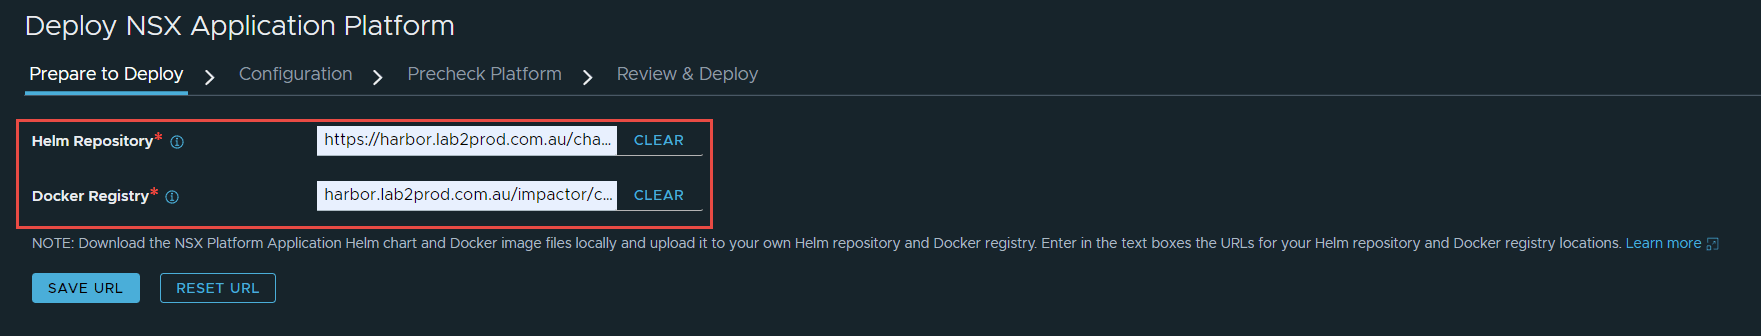
Helm Repository: https://harbor.lab2prod.com.au/chartrepo/impactor
Docker Registry: harbor.lab2prod.com.au/impactor/clustering
Once complete, click Save URL.
I wanted to highlight the importance of having a trusted certificate, as mentioned in part 2. The image below shows the result of having an improper certificate assigned to your harbor registry.
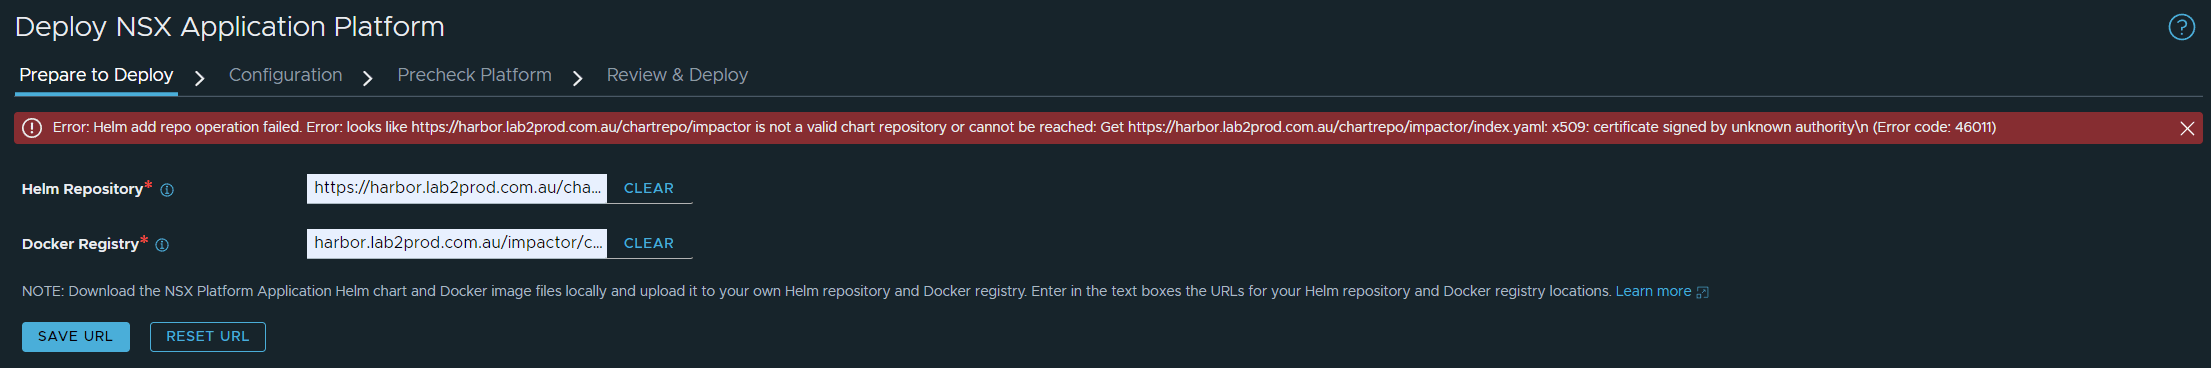
You can manually trust the chain to move past this issue, however, as mentioned in part 2, once begin your deployment, the cert-manager namespace will fail with an x509 untrusted certificate error.
If you have configured everything correctly, with an appropriate certificate, you will see the below.
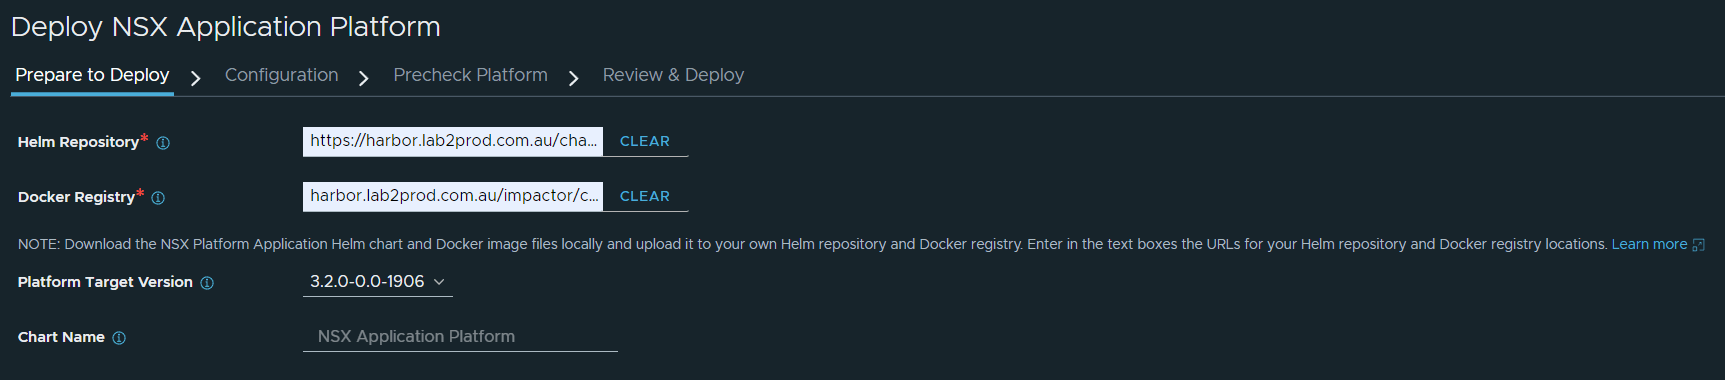
Click Next.
4. On the next page (configuration), select and upload the kubeconfig file you generated in the previous section.
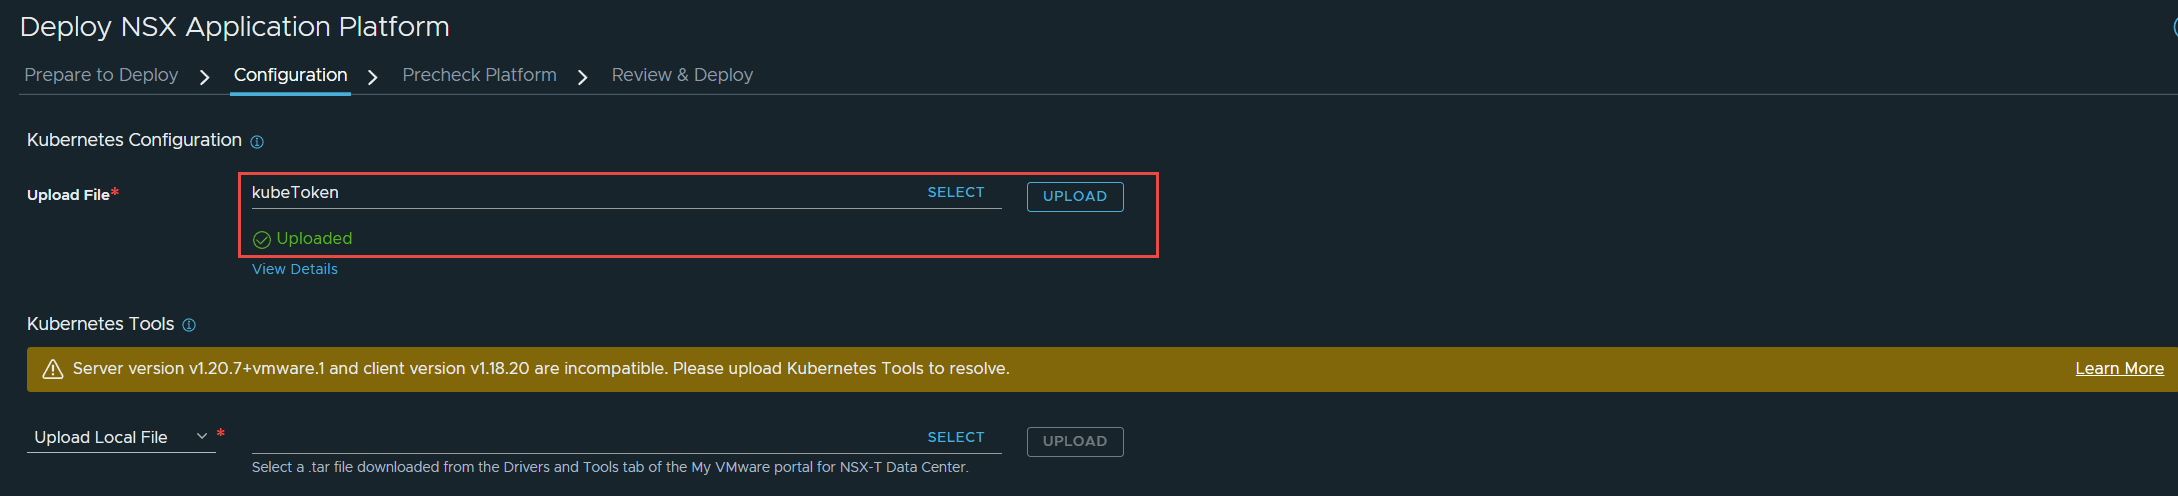
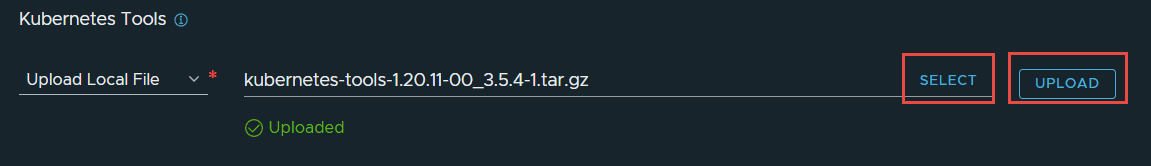
After the file is uploaded it authenticates with the server and picks up details such as cluster type and storage class, this will be shown in the next step. Notice the golden banner stating “Server version v1.20.7+vmware.1 and client version v1.18.20 are incompatible. Please upload Kubernetes Tools to resolve.” This is indicating that there is a kubernetes tools version mismatch between the client (NSX) and the Tanzu cluster.
You can download the the latest bundle from here.

Once downloaded, in NSX-T manager, click on select and then upload the bundle.
5. Now choose the Storage Class. The Service Name needs to be correct or else the deployment will fail almost immediately. From what I can see, a DNS lookup is performed with the FQDN entered, and whatever IP address comes back is added as the ingress / contour / envoy load balancer IP. So ensure you create an appropriate DNS entry and IP address. In my case, I have created a DNS entry in the vip-tkg range.

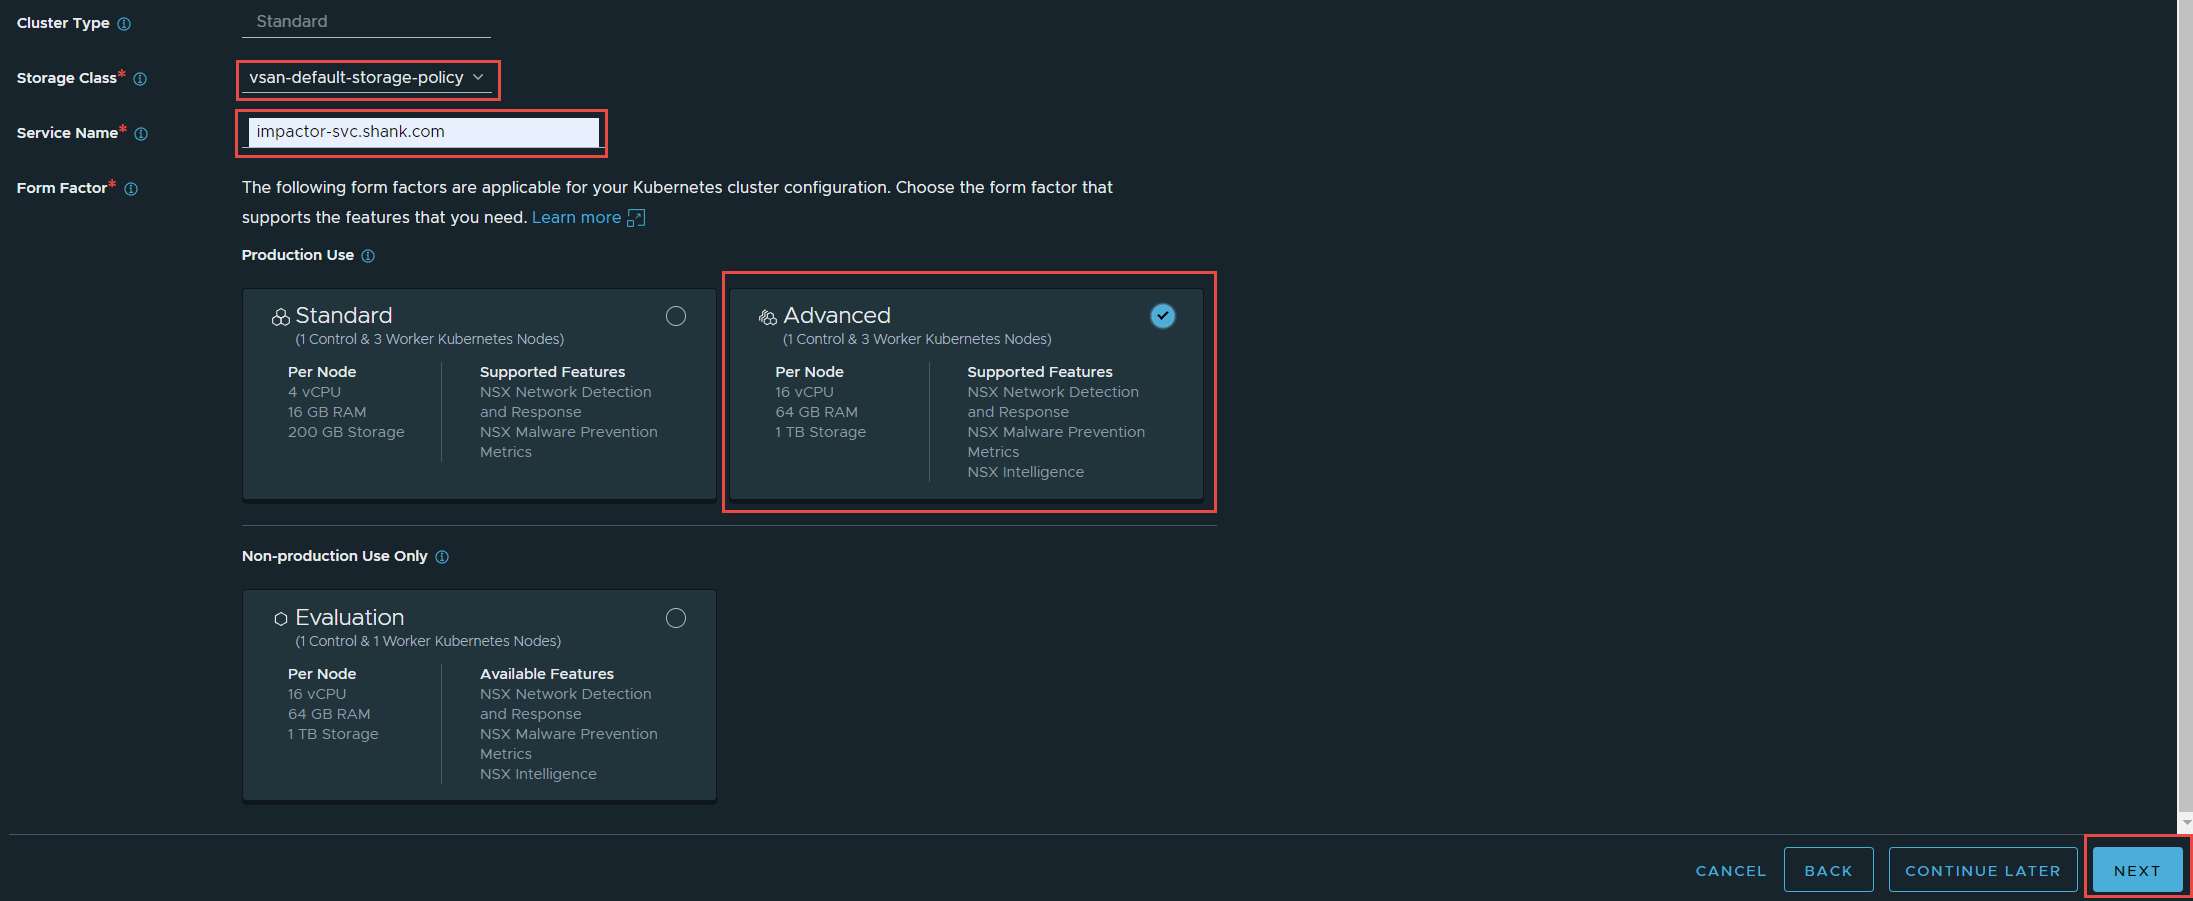
If you used the cluster.yml file I provided in part 3 then you have enough resources to deploy the Advanced form factor. I am deploying advanced as I want to run NSX Intelligence, choose whichever option suits your needs. Once all that is done, click Next.
6. The next page is the Precheck Platform page, click on prechecks and allow it to complete. If there are any errors you must remediate them.
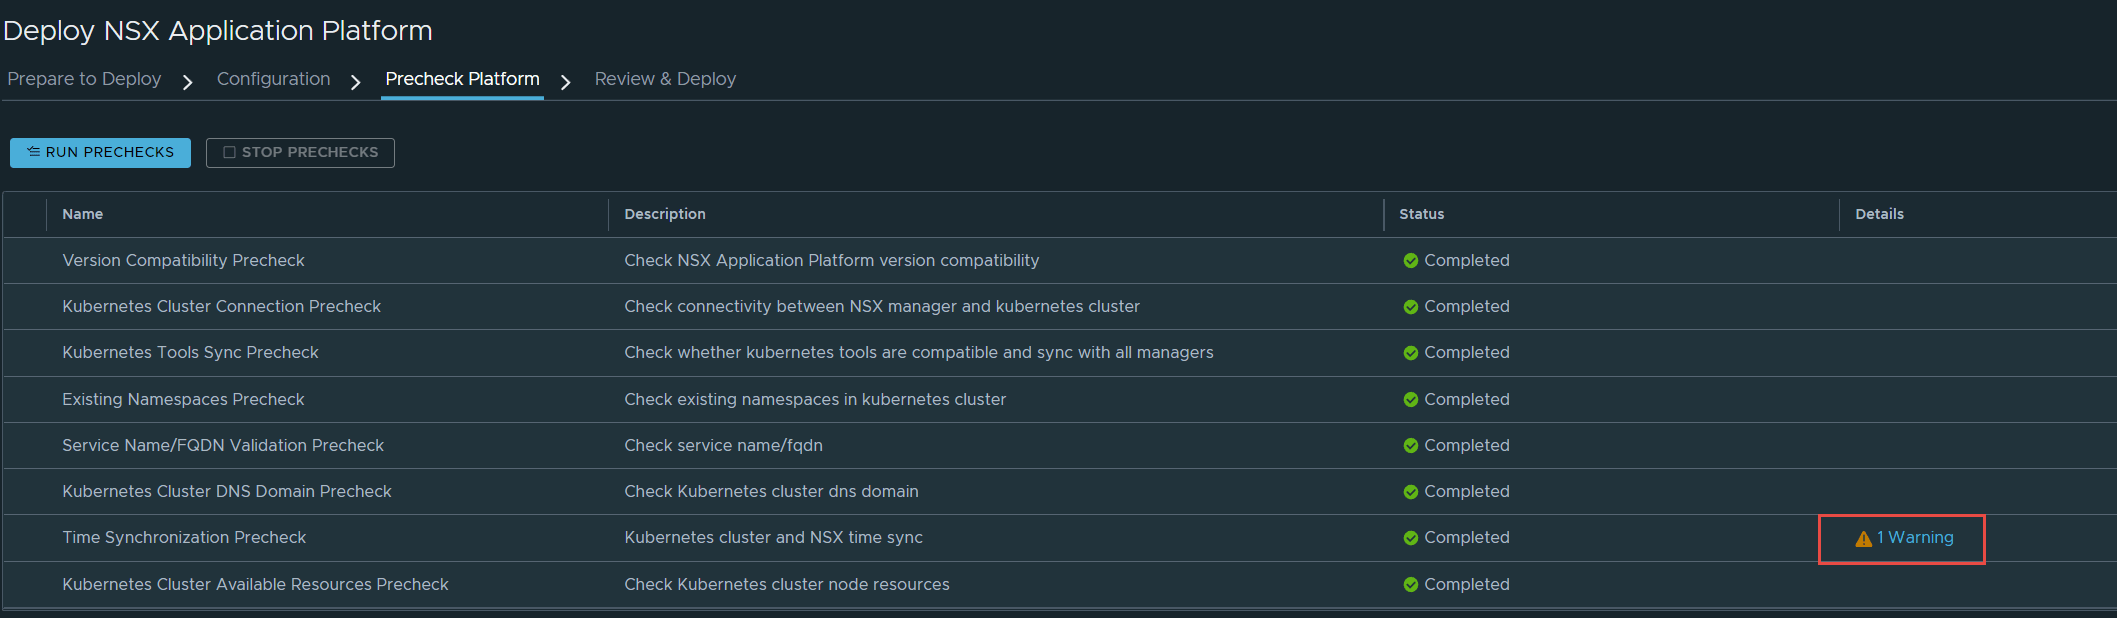
As you can see, all checks completed successfully, except for one warning. This is a time syncrhonization warning between the Kubernetes cluster and NSX-T. This is not a showstopper and you are able to continue. Click on Next.
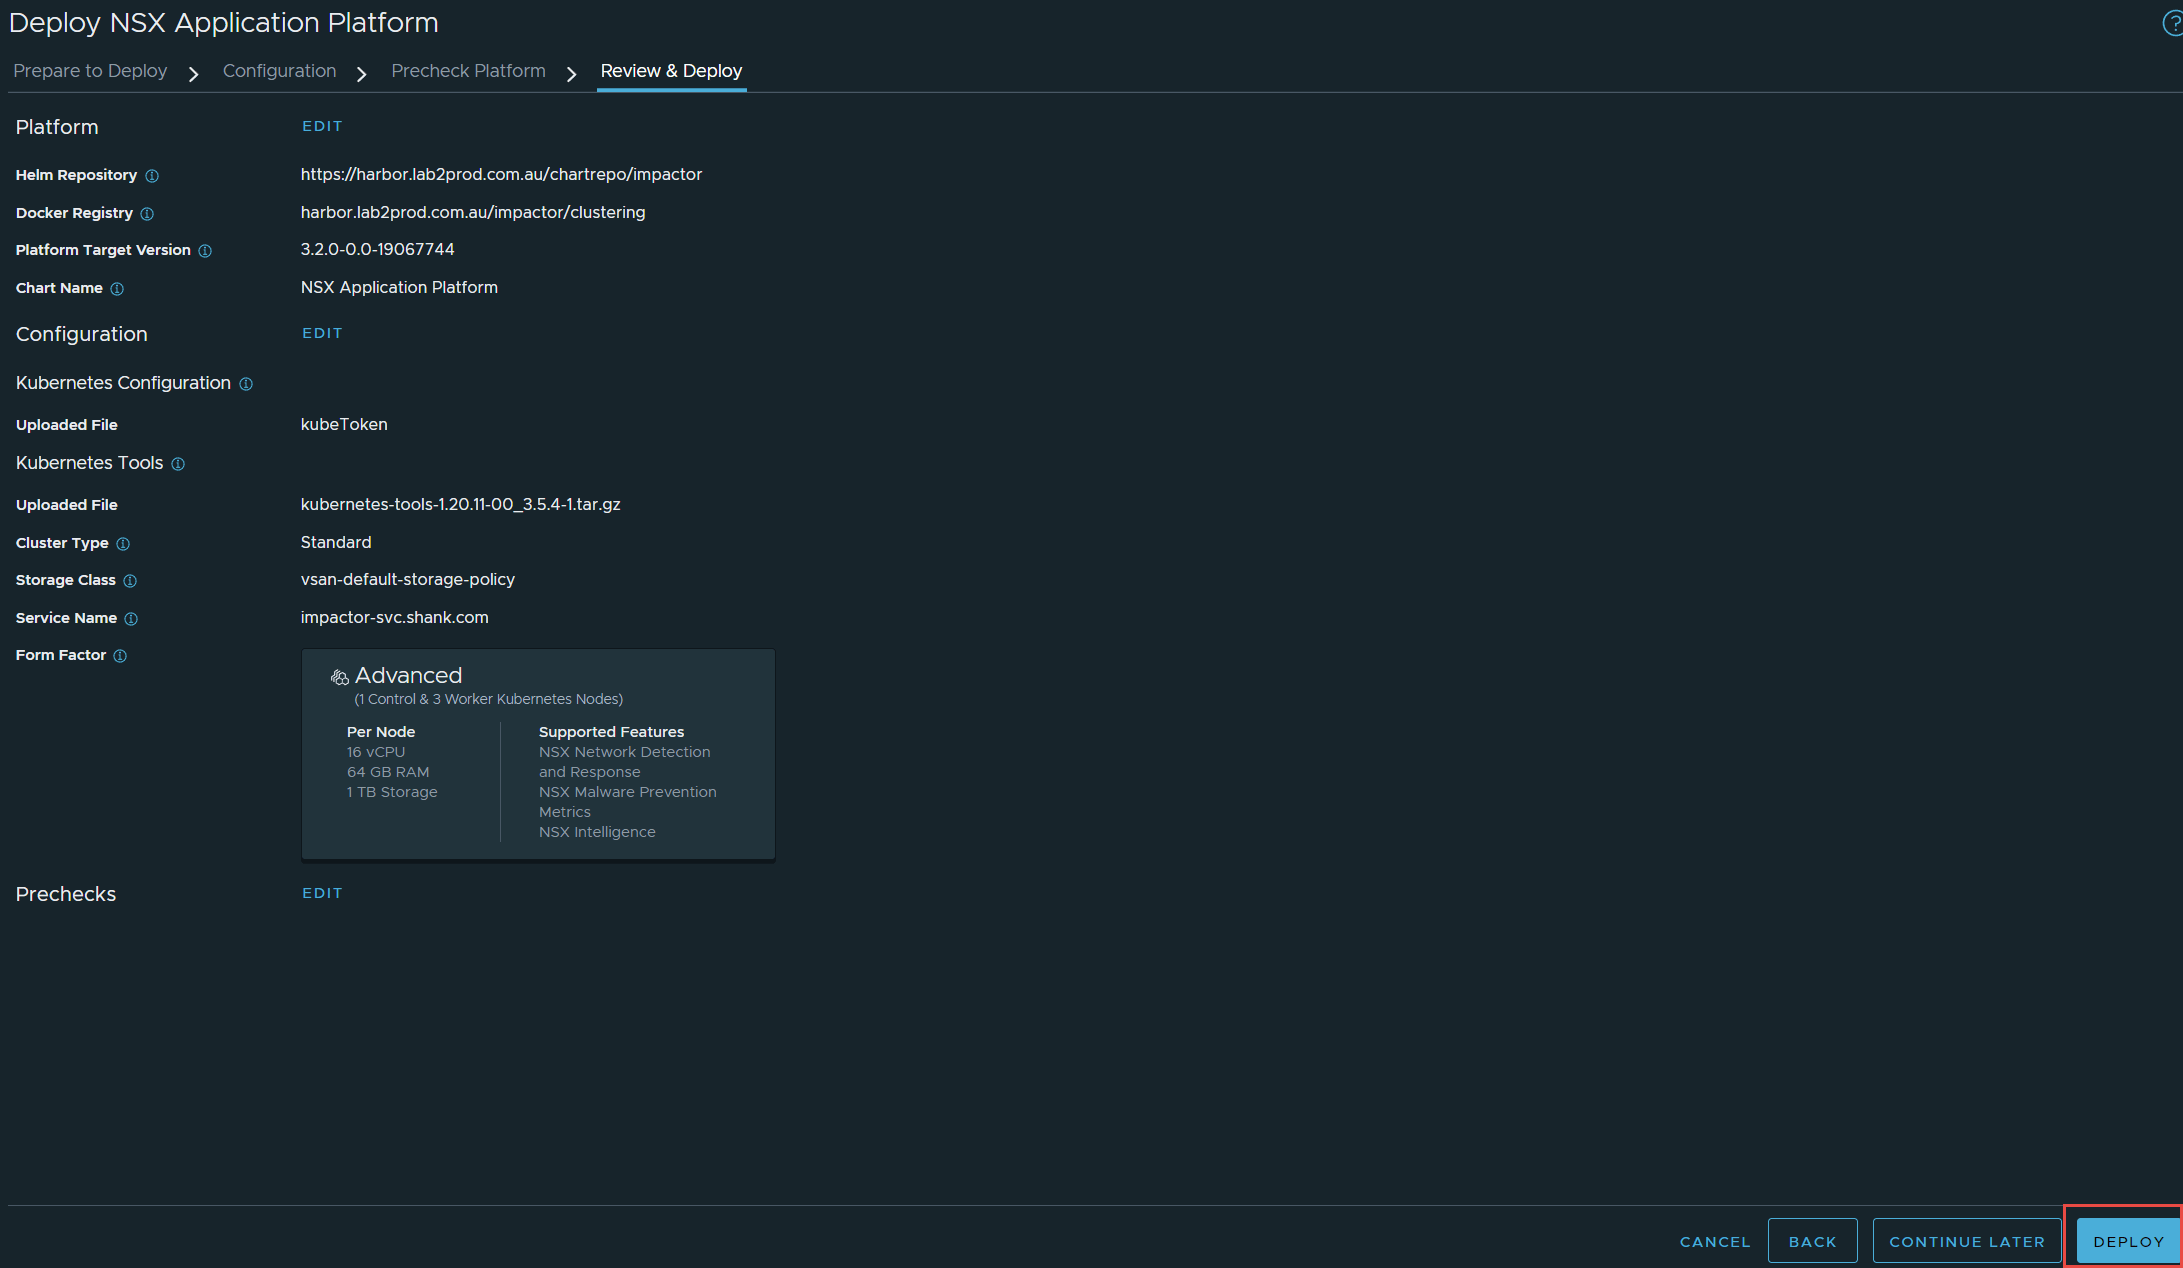
7. The final screen is a Review & Deploy, this is your last chance to change any of the settings. Click Deploy when you are ready.
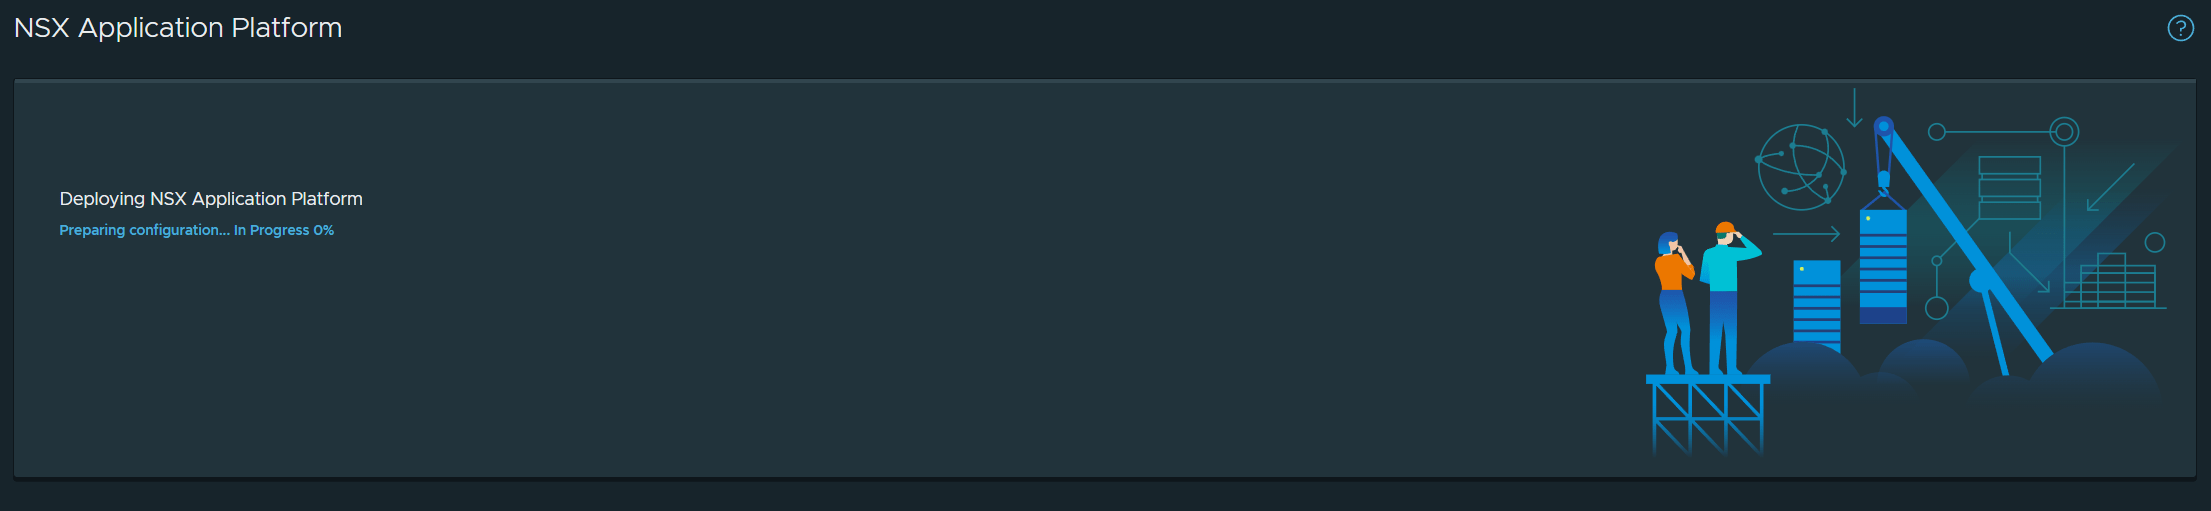
The deployment will begin, allow the process to complete.
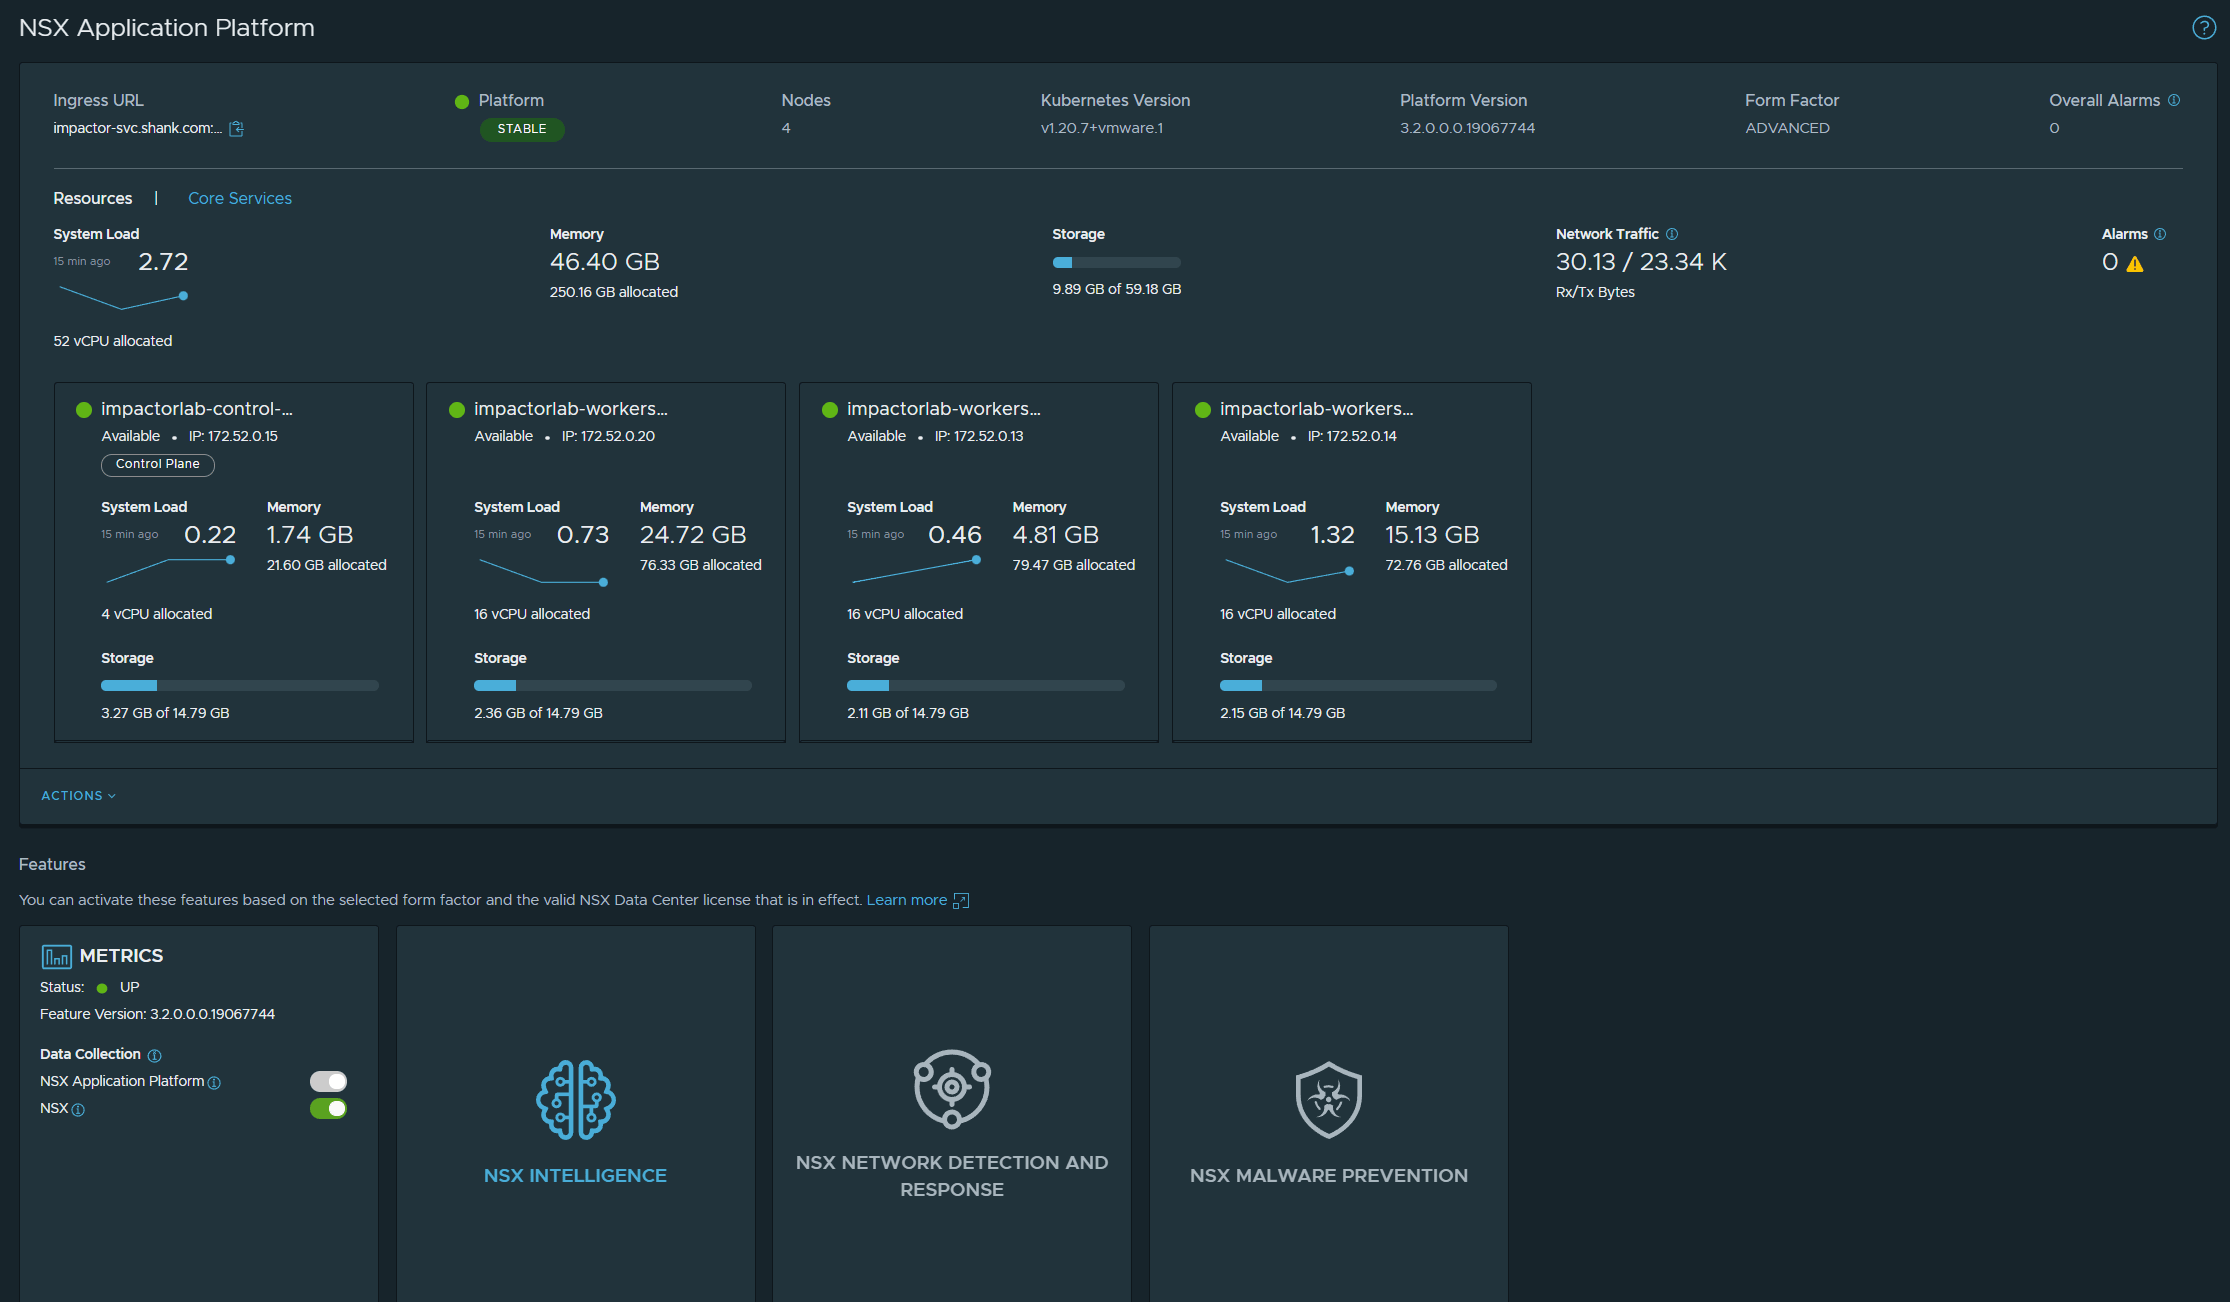
8. If everything was configured correctly, your deployment should succeed.
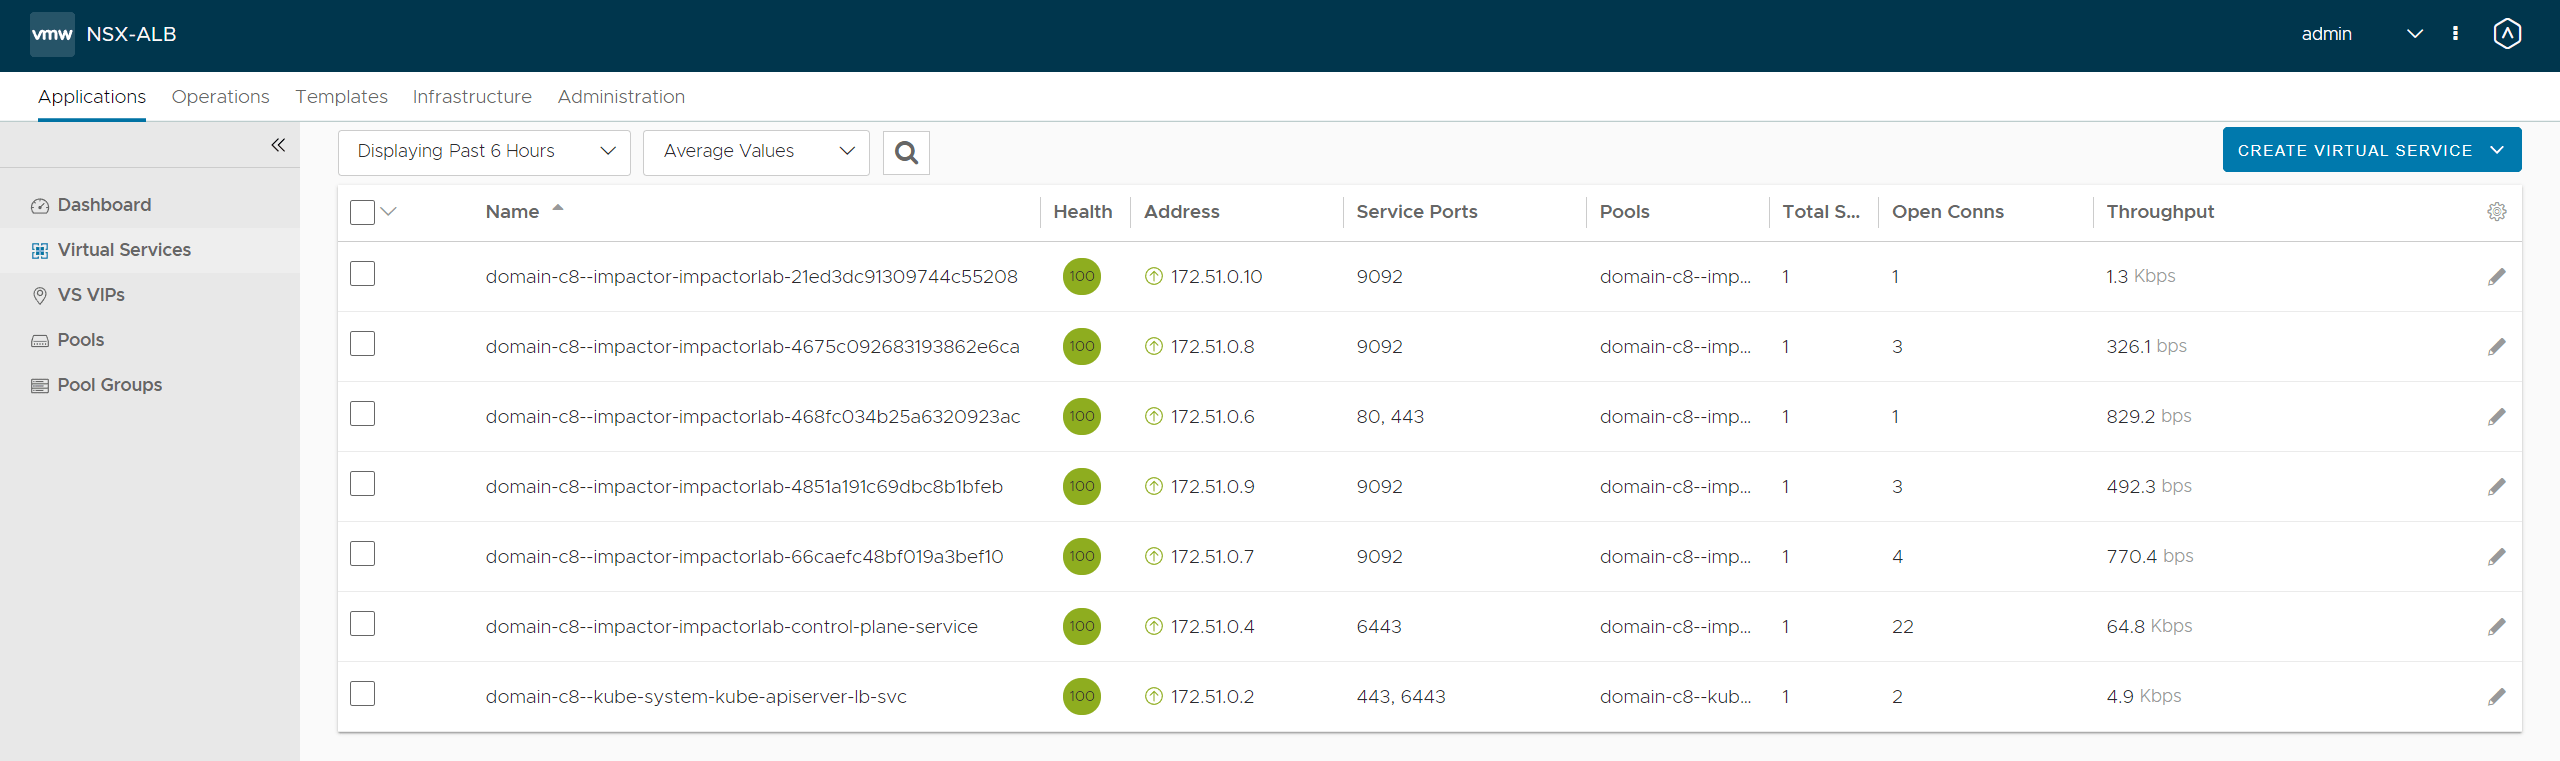
The image below displays all the VIPs that were created during the deployment of NAPP.
Advanced Threat Protection (ATP)
ATP consists of IDS/IPS, Malware Analysis and Prevention, and Network Traffic Analysis (NSX Intelligence). It is important to note that NAPP is not required for IDS and IPS.
NAPP allows administrators to bolster their security with the addition of Malware Analysis and Prevention, Network Traffic Analysis (NSX Intelligence), and Network Detection and Response (NDR).
Enabling NAPP Features
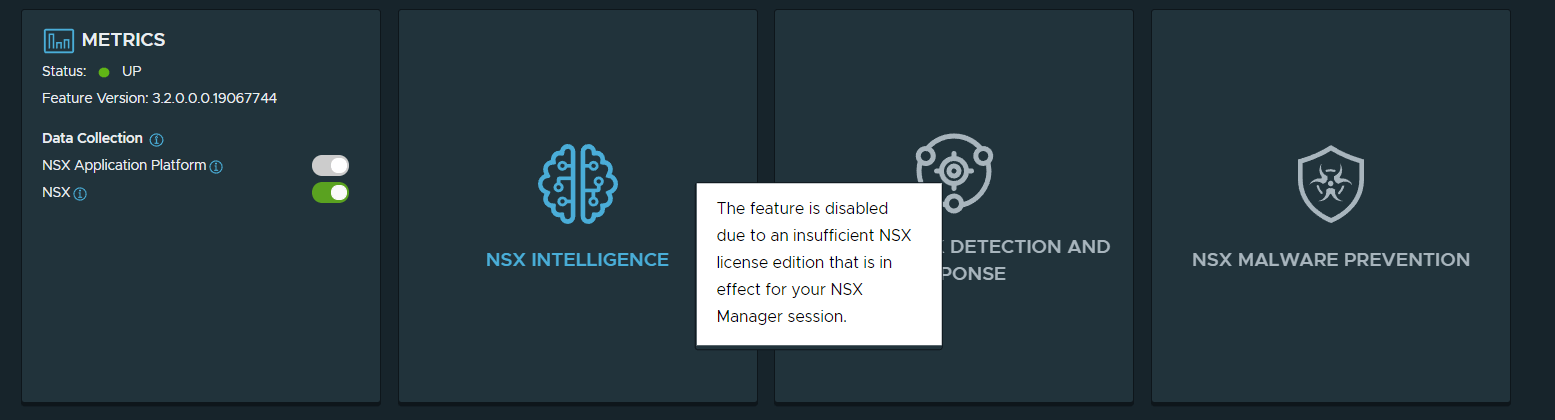
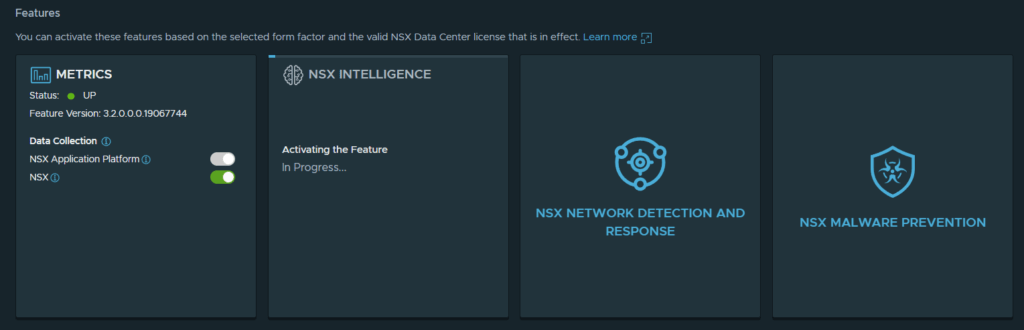
You must have a license that is fit for purpose, if you do not have an adequate license, you cannot enable the NAPP features. You will see the message below if you do not have an appropriate license.
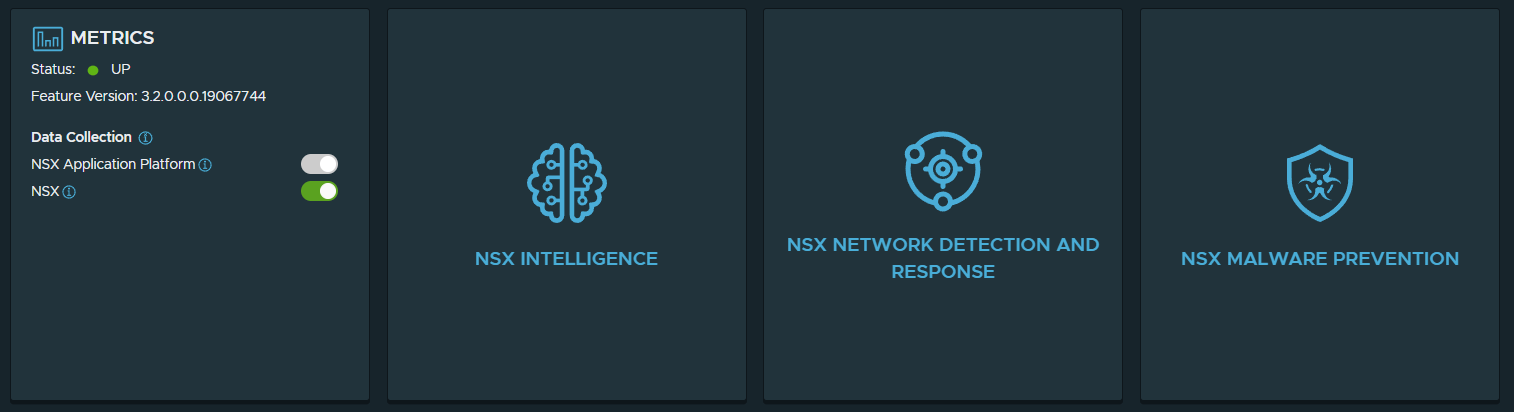
After applying the license, you will see all tiles enabled.
NSX Intelligence
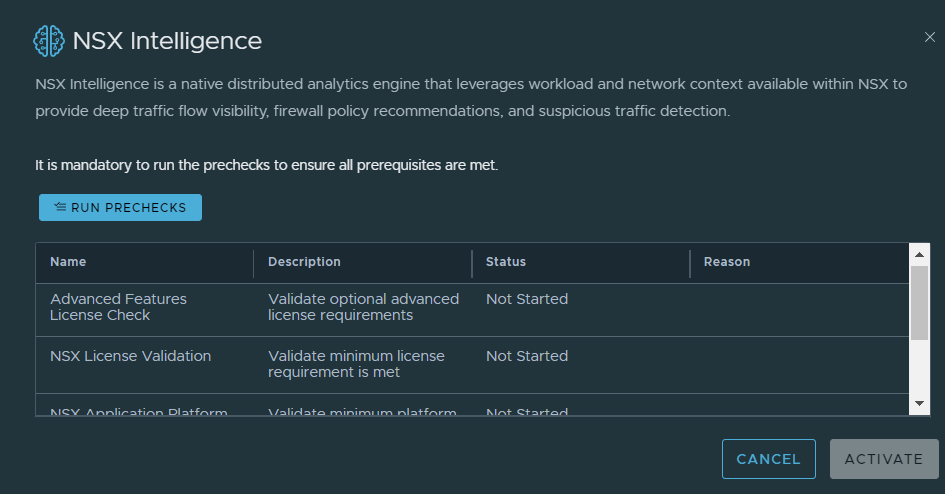
This section will highlight the process to get NSX Intelligence activated.
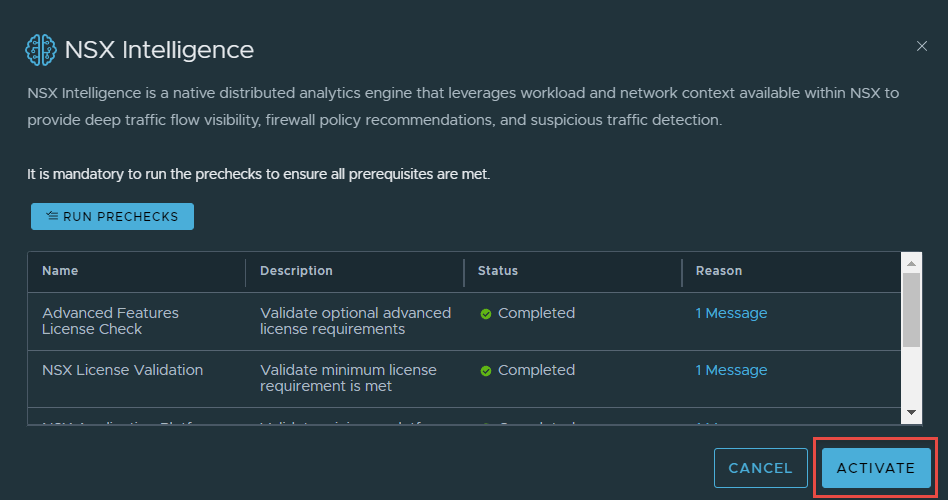
- Click on NSX Intelligence in the NSX Application Platform screen, in NSX-T Manager. You will be greeted with a precheck screen. Run the prechecks and make sure everything passes.
2. Once all checks pass, you will be able to activate the feature. I have seen this process take up to 30 minutes, the timeframe will vary depending on your environment.
3. Intelligence has successfully activated.
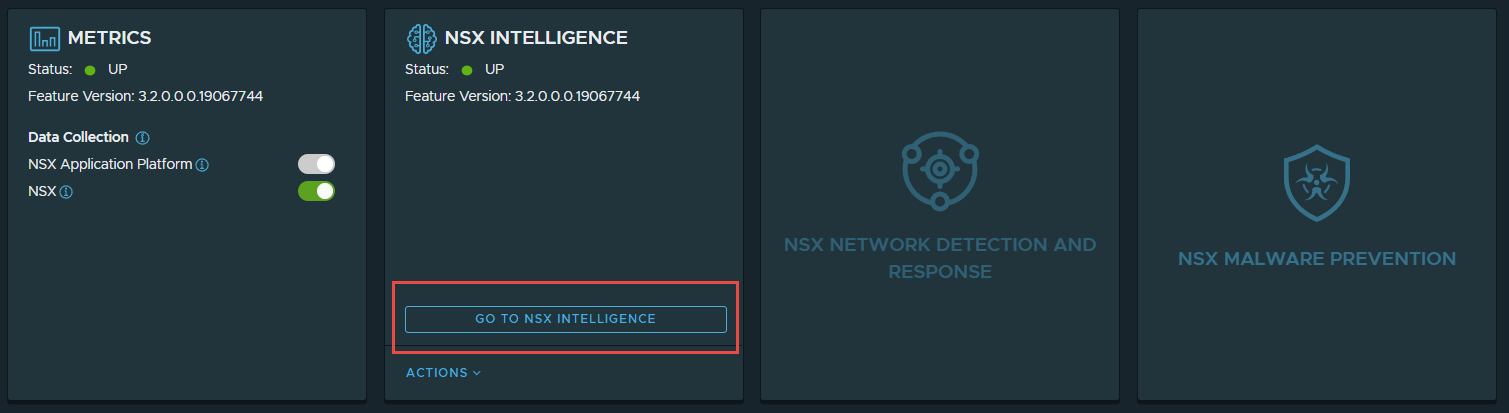
4. Click on “Go to NSX Intelligence”, doing so will redirect you to the “Plan & Troubleshoot” page.
This completes the activation of NSX Intelligence. I will not walking through configuration of NSX Intelligence in this article.
Network Detection and Response
This section will highlight the process to activate “NSX Network Detection and Response”.
- Navigate to System -> NSX Application Platform -> Click on “Activate” in NSX Network Detection and Response”.
- As part of the workflow, an unauthenticated GET request is sent to https://nsx.lastline.com/nsx/cloud-connector/api/v1/papi/accounting/nsx/get_cloud_regions.json. This retrieves the list of cloud regions to connect to. My first attempt at deploying this, I faced the below error.
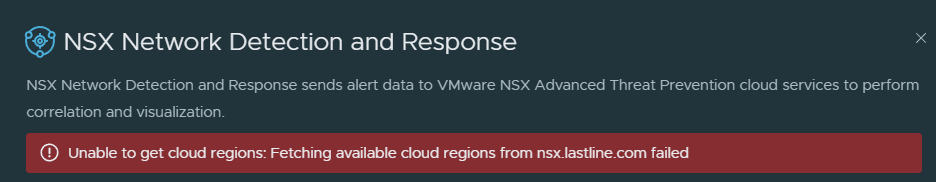
This is after allowing the NSX-T manager and VIP subnet full internet access. I tailed my firewall, and noticed the IP 172.52.0.14 hitting a deny rule when attempting a connection on 443 to 38.95.226.10. The source IP is one of my worker nodes, the destination IP address is nsx.lastline.com. It seems the worker nodes require internet connectivity to be able to enable this feature, make sure you have internet connectivity if you are enabling this feature.
Once you allow the connection through the firewall (if you have this issue), you should be able to see the regions to select from.
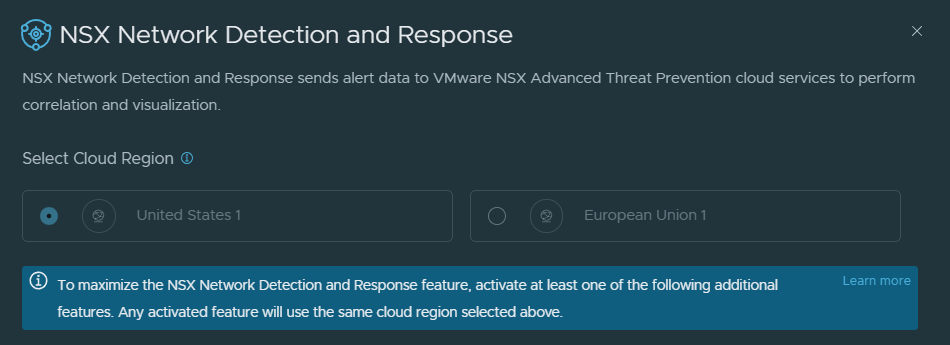
3. Select your preferred Cloud Region, and then run Prechecks.
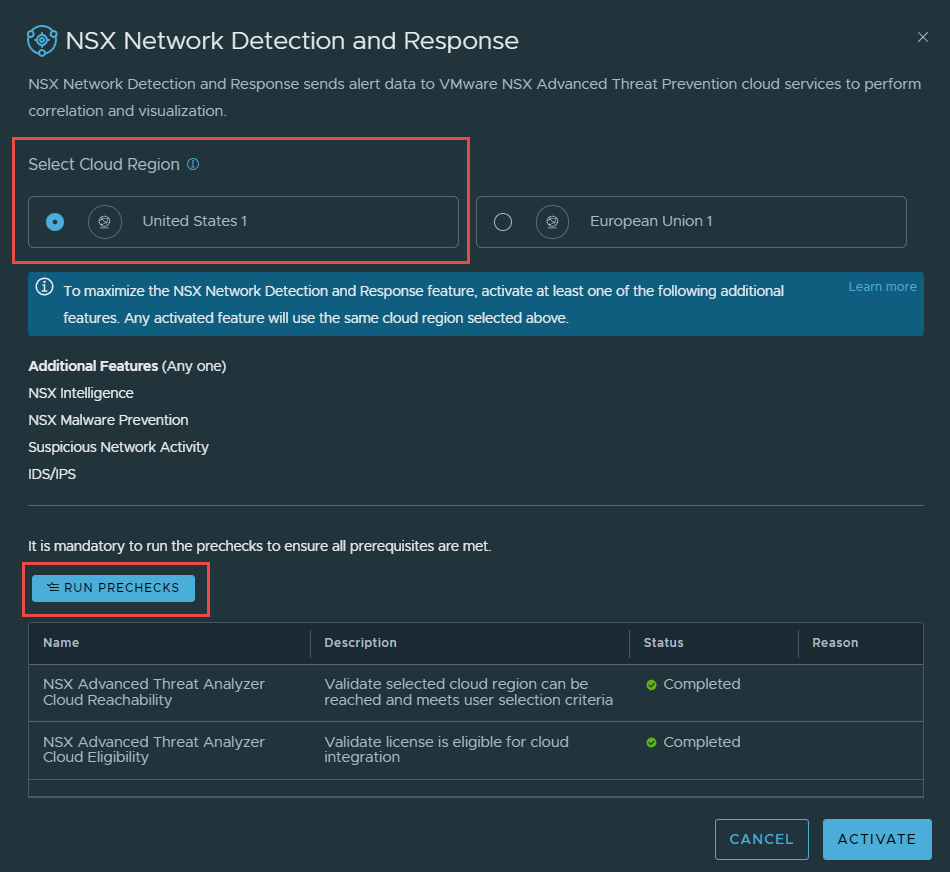
4. Once the prechecks are complete, click on Activate. The deployment will start, and in my environment took about 3 minutes.
As part of this process, additional pods are deployed into the nsxi-platform namespace. Issue the command below to see the additional pods. I have omitted older pods that were not created as part of NDR’s deployment.
root@jump:~# kubectl get pods -n nsxi-platform
NAME                                                          READY   STATUS      RESTARTS   AGE
cloud-connector-register-q5ssm                                0/2     Completed   0          11m
cloud-connector-proxy-84fd8f998d-h6ng6                        2/2     Running     0          10m
cloud-connector-check-license-status-7d8c8c9c7b-sxph8         2/2     Running     0          10m
cloud-connector-update-license-status-7bbbc7cf7d-wlh4r        2/2     Running     0          10m
nsx-ndr-setup-kafka-qmtp7                                     0/1     Completed   0          10m
nsx-ndr-enable-ids-zcq8z                                      0/1     Completed   0          9m36s
nsx-ndr-upload-config-9f968f76c-2nb2c                         2/2     Running     0          9m29s
nsx-ndr-worker-monitored-host-uploader-5858b5c97c-qhrc8       2/2     Running     0          9m29s
nsx-ndr-feature-switch-watcher-notifier-ndr-7d48fb9bd-v4ffj   1/1     Running     0          9m29s
nsx-ndr-worker-monitored-host-processor-77cfc98b7c-8mwjs      2/2     Running     0          9m29s
nsx-ndr-worker-file-event-uploader-d5589d79d-qkxnh            2/2     Running     0          9m29s
nsx-ndr-worker-ids-event-processor-6c667bc695-zthcv           2/2     Running     0          9m29s
nsx-ndr-worker-ndr-event-processor-586d468ddd-bm4jf           2/2     Running     0          9m29s
nsx-ndr-worker-file-event-processor-848c8c48cb-6fxct          2/2     Running     1          9m29s
nsx-ndr-worker-nta-event-processor-5647bc47fc-7x9v5           2/2     Running     0          9m28s
nsx-ndr-worker-ndr-event-uploader-c7ddb468b-gv54g             2/2     Running     0          9m28s
processing-pod-cleaner-1641516600-78jqs                       0/1     Completed   0          5m5s
druid-rule-monitor-1641516600-kwt8m                           0/1     Completed   0          5m5s
processing-pod-cleaner-1641516900-m6ssw                       0/1     Completed   0          3s
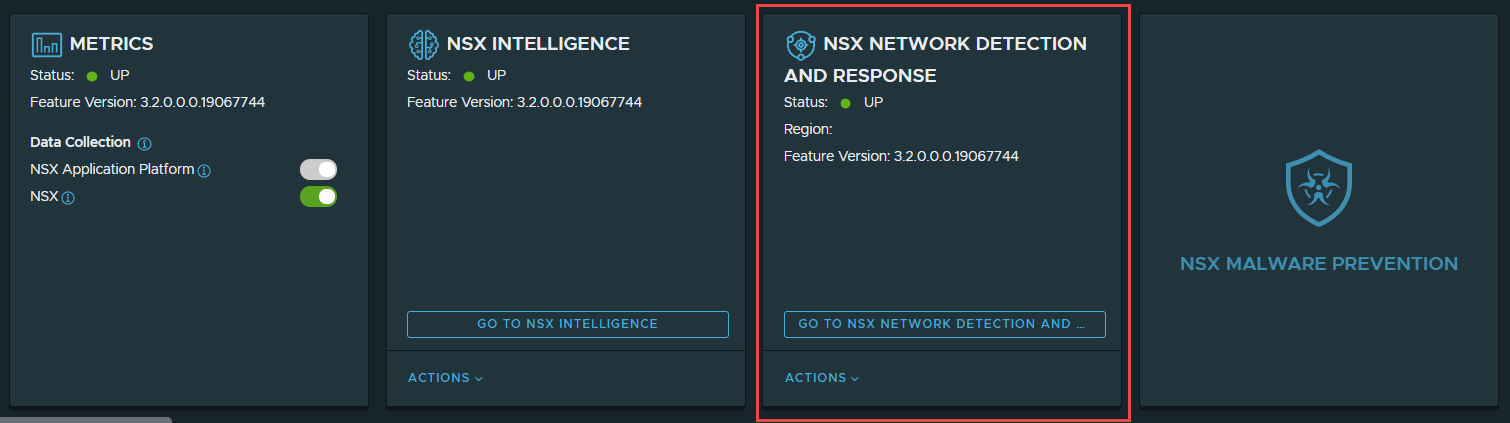
5. Click on “Go To NSX Network Detaction and Response”, and you will be redirected to this screen.
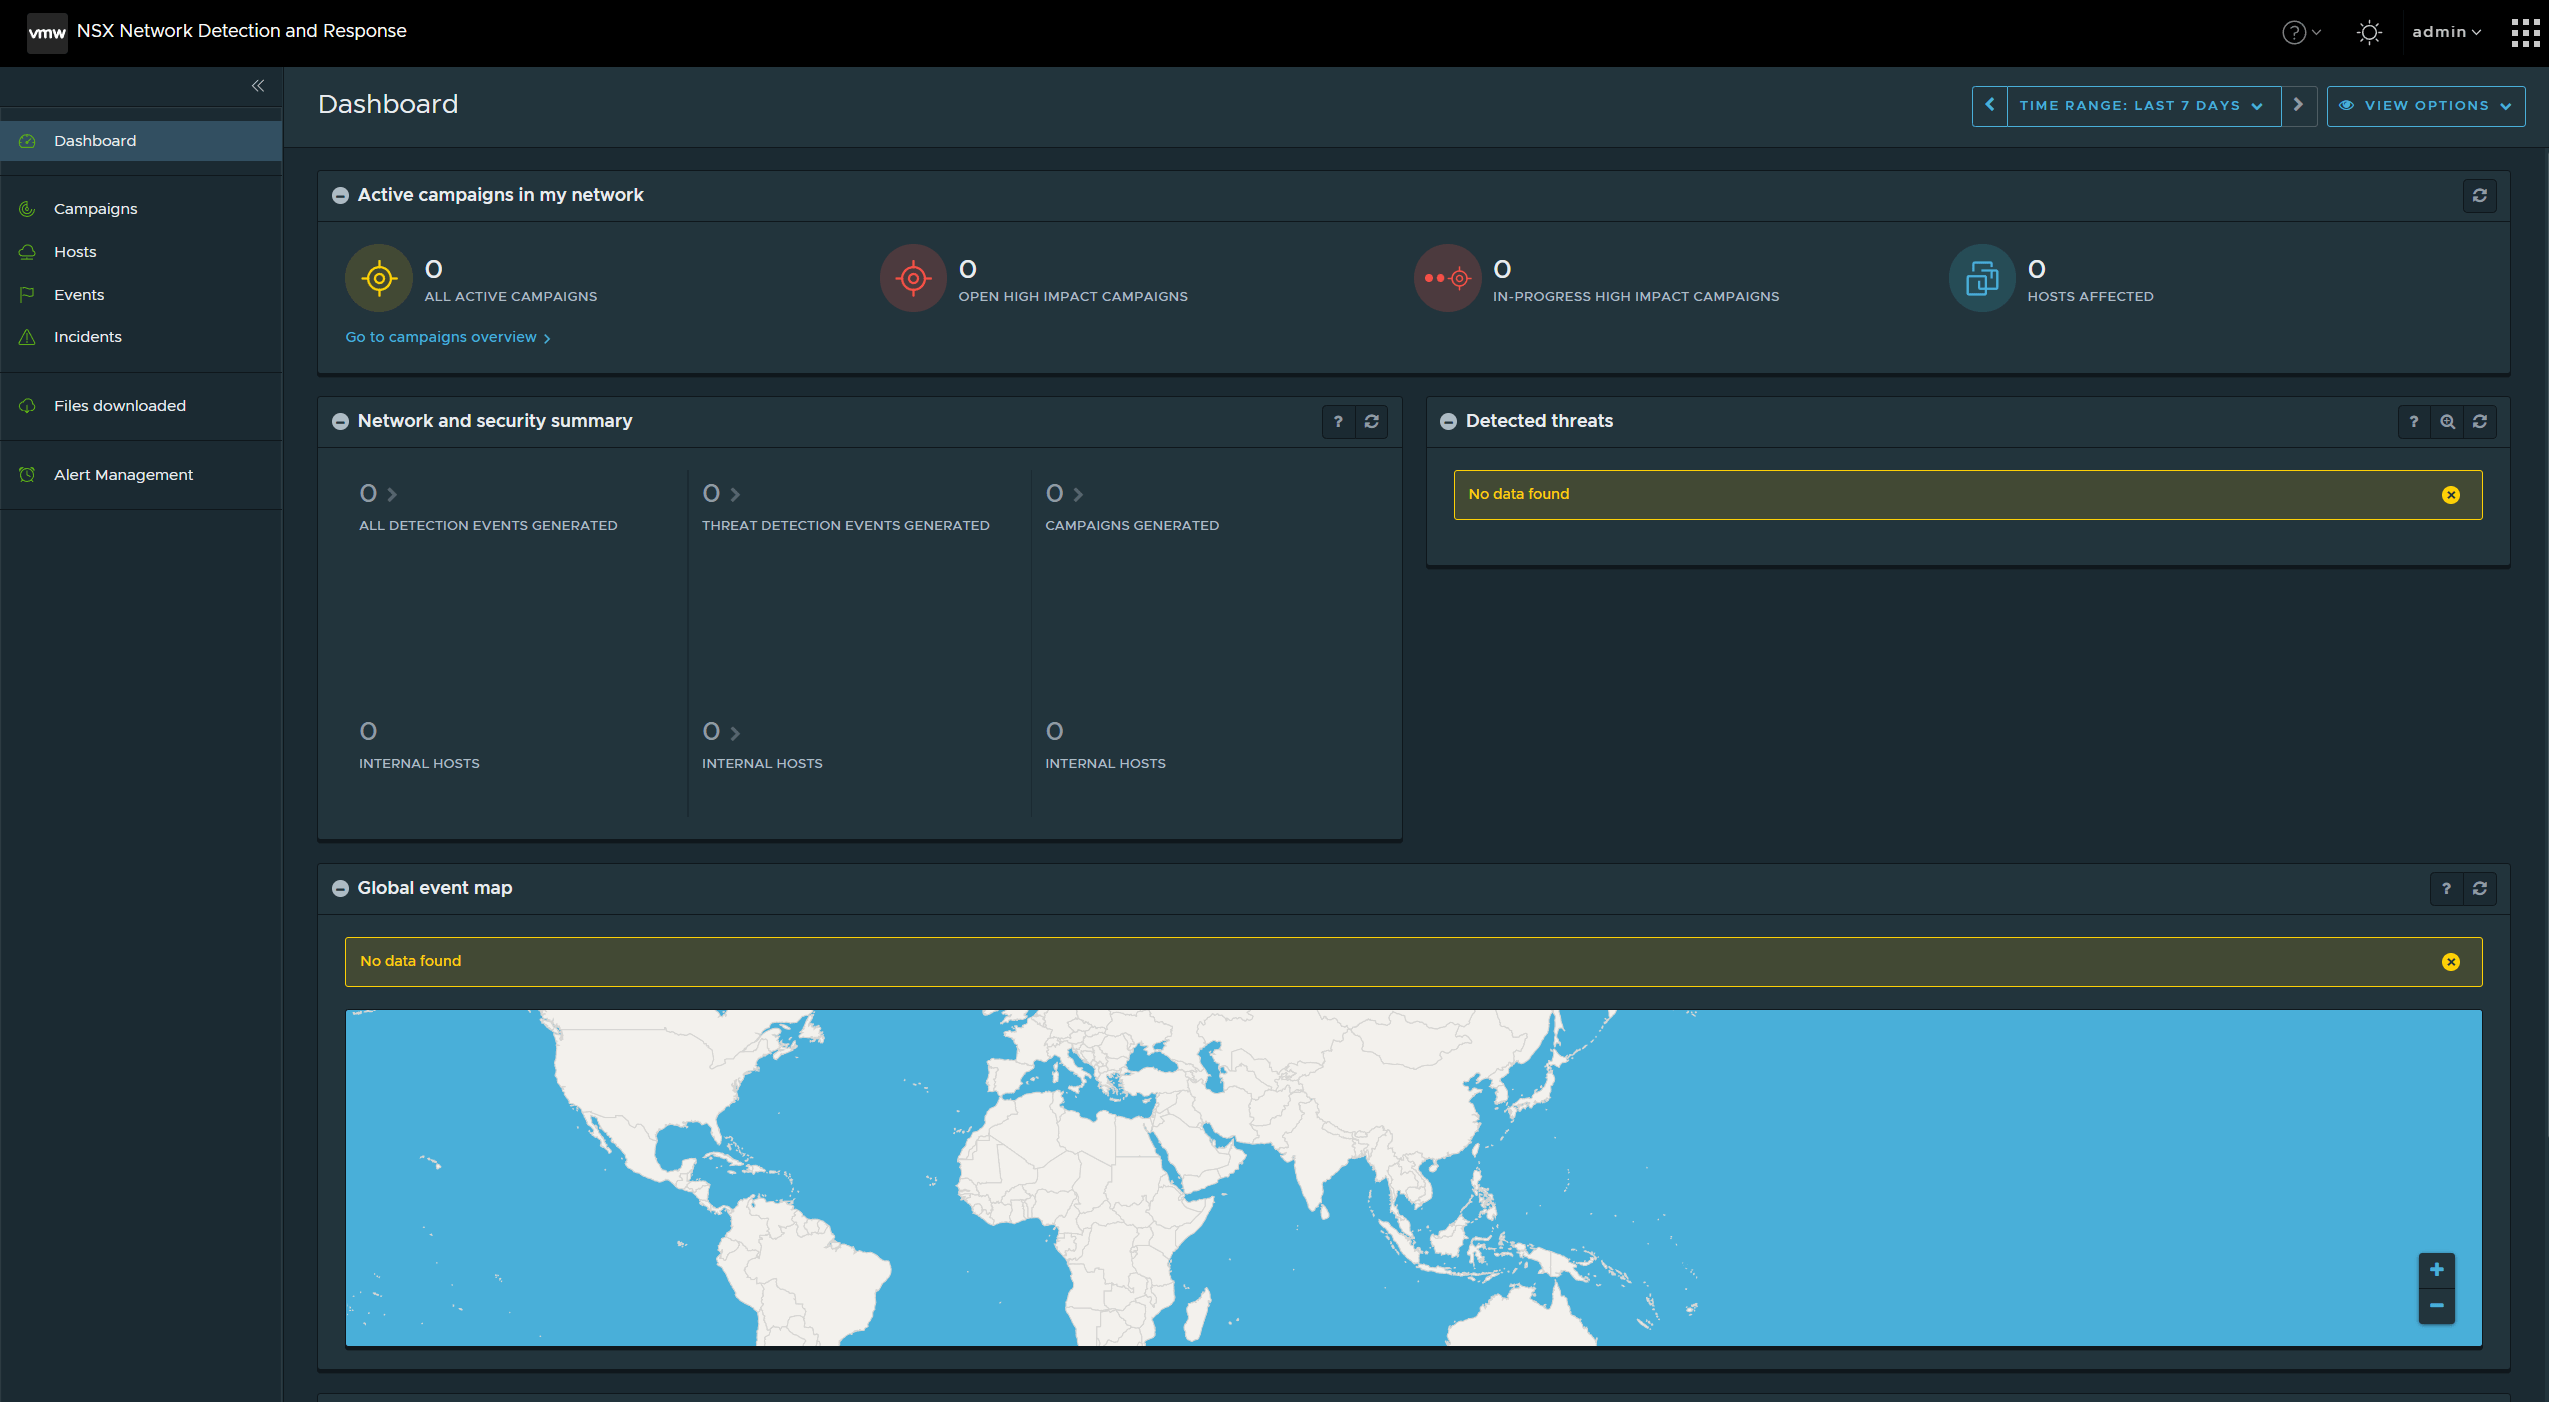
Note: I will not walk through configuration of NDR in this article.
NSX Malware Prevention
- Navigate to System -> NSX Application Platform -> Click on “Activate” in NSX Malware Prevention”.
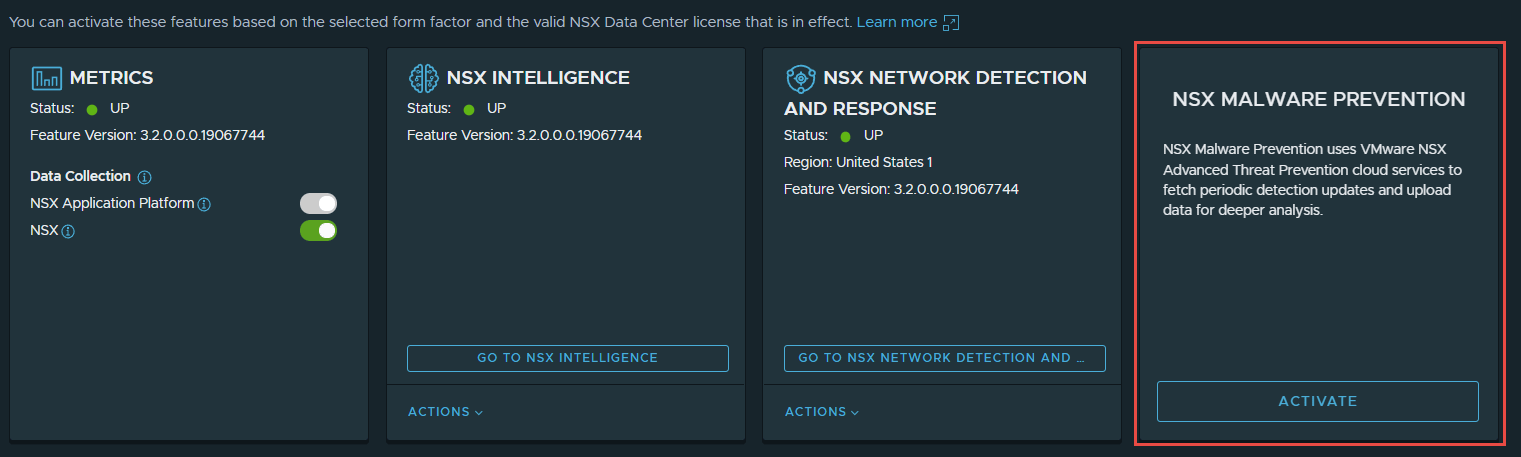
2. The cloud region will already be configured, as the same one that was selected for NDR will be used for Malware prevention. Run the prechecks and make sure everything passes.
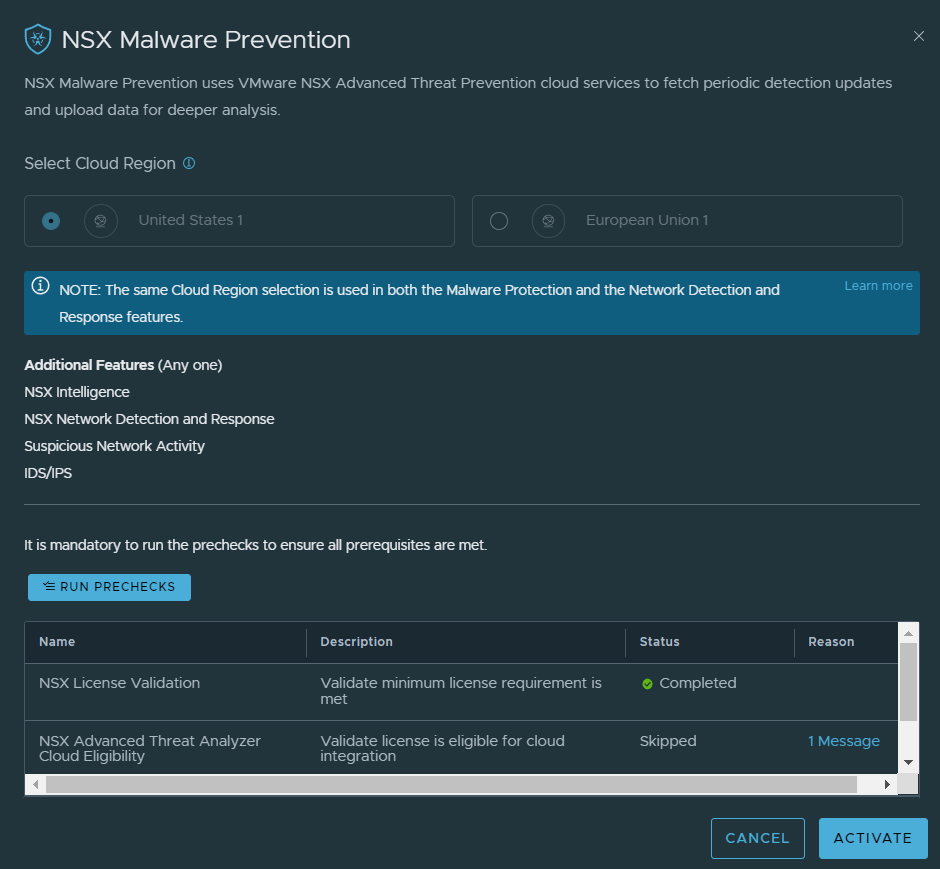
If you deployed NDR already, one component precheck will be skipped, which is “NSX Advanced Threat Analyzer Cloud Eligibility” and that is because the component was already deployed. Click Activate once complete. The process took approximately 3 minutes to complete in my lab.
Issuing the command below, I was able to see the most recent pods that were created after initiating the deployment.
root@jump:~# kubectl get pods -n nsxi-platform --sort-by=.metadata.creationTimestamp
continuousmonitoringjob-driver                                    0/1     Completed   0          9m2s
reputation-service-feature-switch-watcher-notifier-dependejtg2d   1/1     Running     1          4m36s
malware-prevention-feature-switch-watcher-notifier-ndr-5bbmrhf5   1/1     Running     0          3m37s
sa-events-processor-5fb47cb57b-mpq7c                              1/1     Running     0          3m37s
mps-post-install-jobs-hm5bv                                       0/1     Completed   0          3m37s
sa-asds-5c7cd976f9-rvcdg                                          1/1     Running     0          3m37s
malware-prevention-create-kafka-topic-446f4                       0/1     Completed   0          3m37s
sa-scheduler-services-659c566c5-xwz65                             1/1     Running     0          3m37s
malware-prevention-ui-6f49f9b7d9-4hff8                            1/1     Running     0          3m37s
sa-web-services-54fb4d87cf-cnn77                                  1/1     Running     0          3m35s
reputation-service-68bd7c6d5b-75gp8                               1/1     Running     0          3m34s
processing-pod-cleaner-1641519000-qvqpf                           0/1     Completed   0          2m26s
pod-cleaner-1641519000-pvq4c                                      0/1     Completed   0          2m26s
druid-rule-monitor-1641519000-kmtqv                               0/1     Completed   0          2m26s
3. In System -> NSX Application Platform -> Click on “Go To NSX Malware Prevention”, you should be redirect to the page below.
This completes the deployment of NSX Malware Prevention.
Distributed Malware Prevention
This section demonstrates the process to enable distributed malware prevention, for this, each hypervisor in the cluster will require the NSX Malware Prevention Service Virtual Machine (SVM). The OVA can be downloaded here.

- Navigate to System -> NSX Application Platform -> NSX Malware Prevention -> Actions -> Settings.
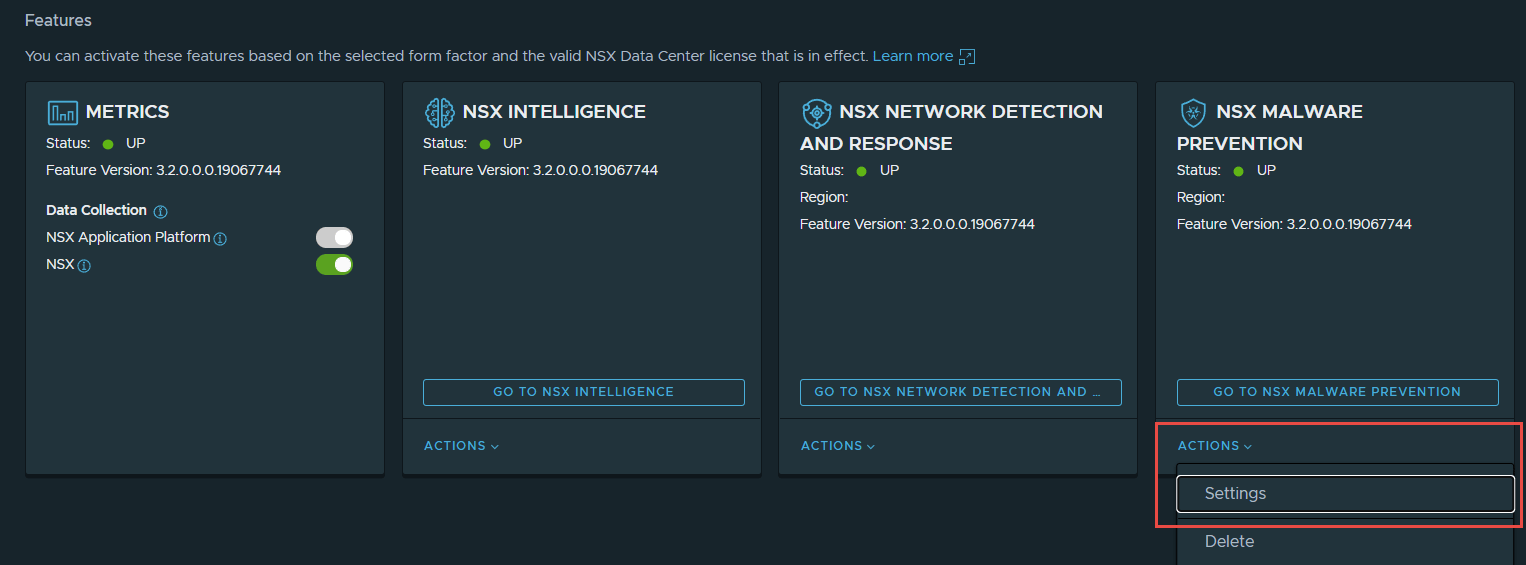
2. Click “Start Setup”.
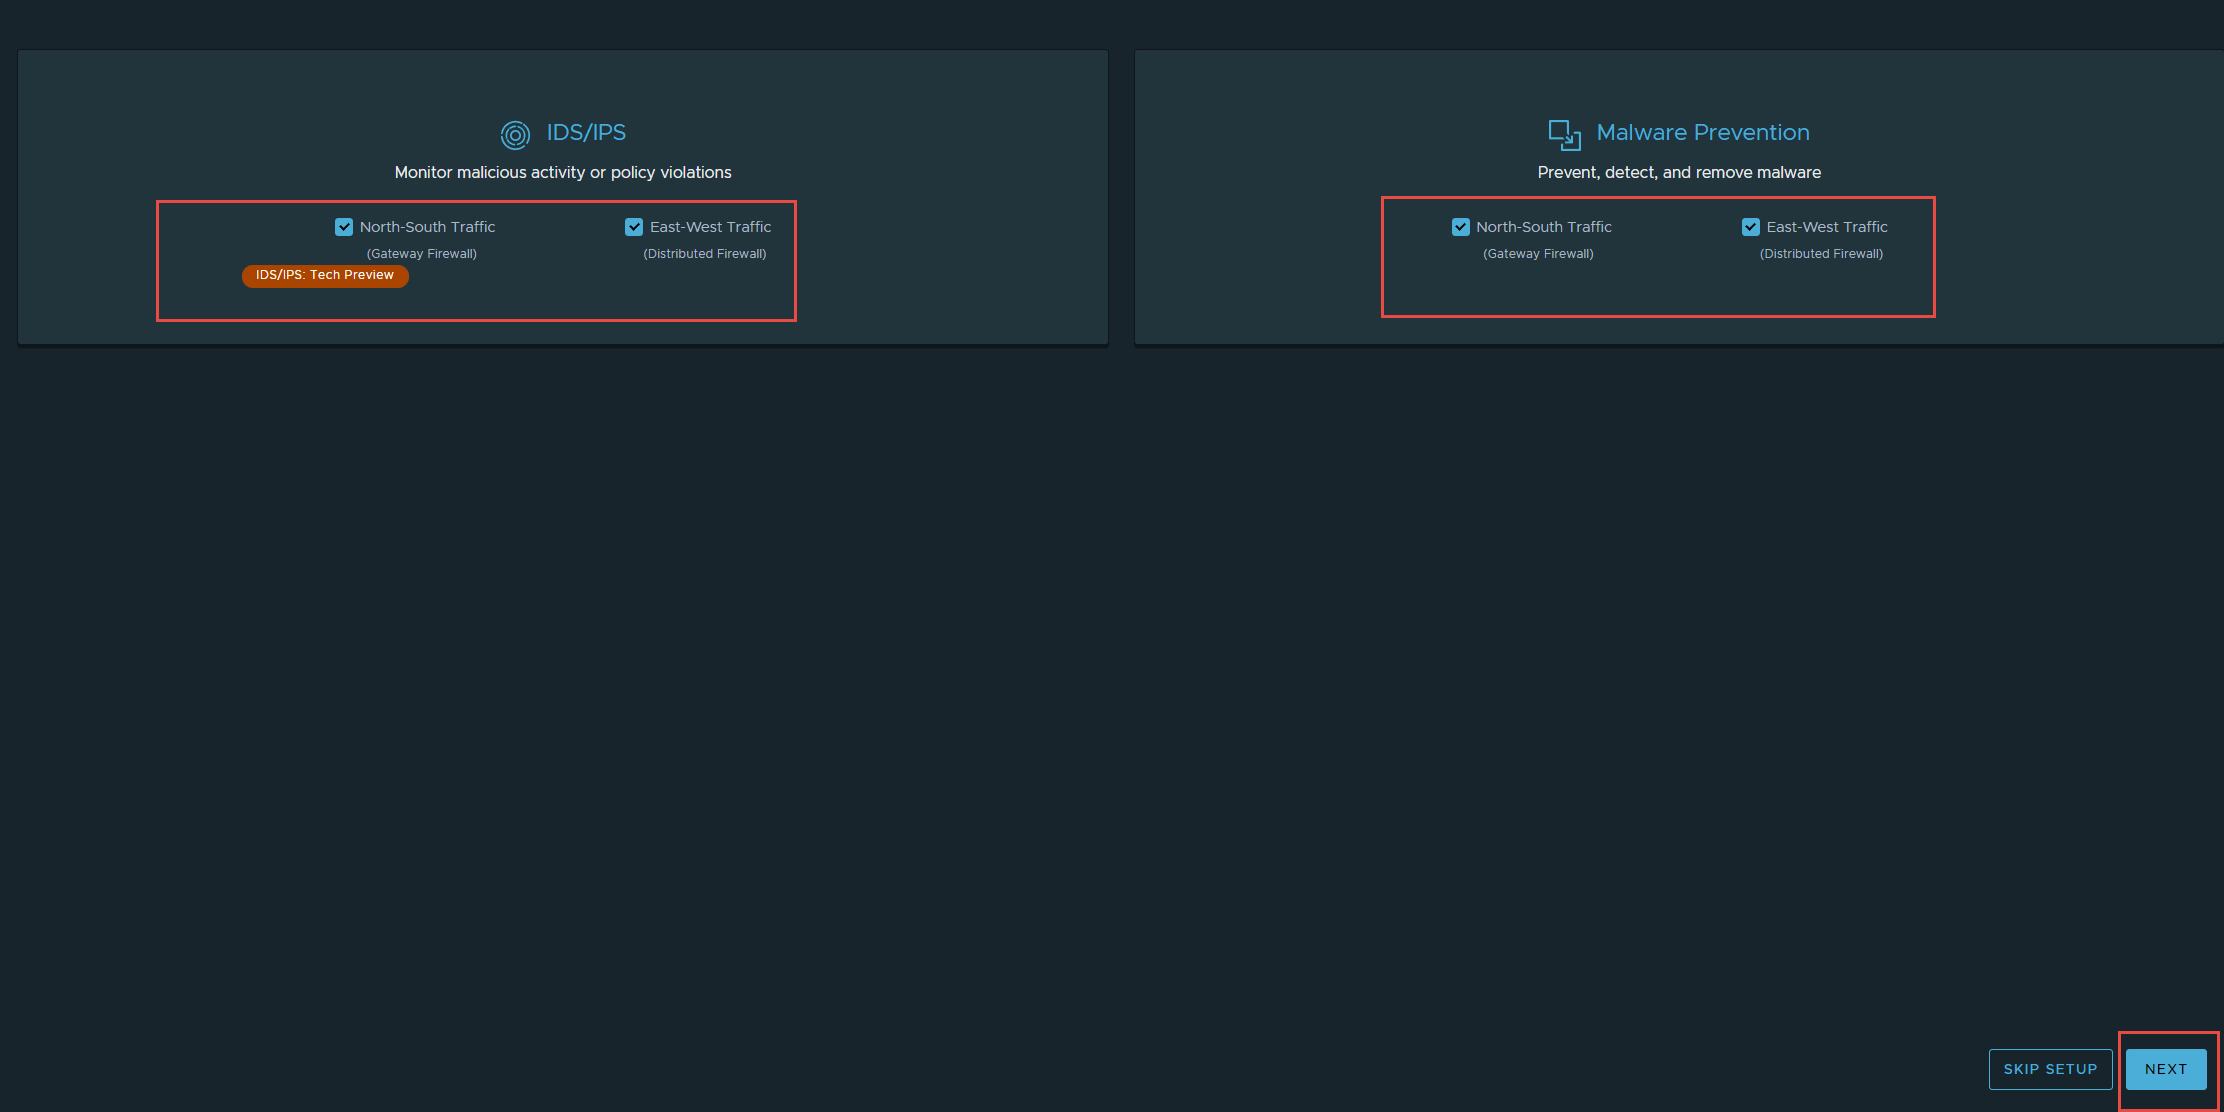
3. In “IDS/IPS & Malware Prevention Setup” I have left everything enabled, feel free to chose the features you want enabled. Click Next, when you are ready.
4. If you need to setup a proxy server for internet connectivity, select “Go To Proxy Server”, if not click Next.
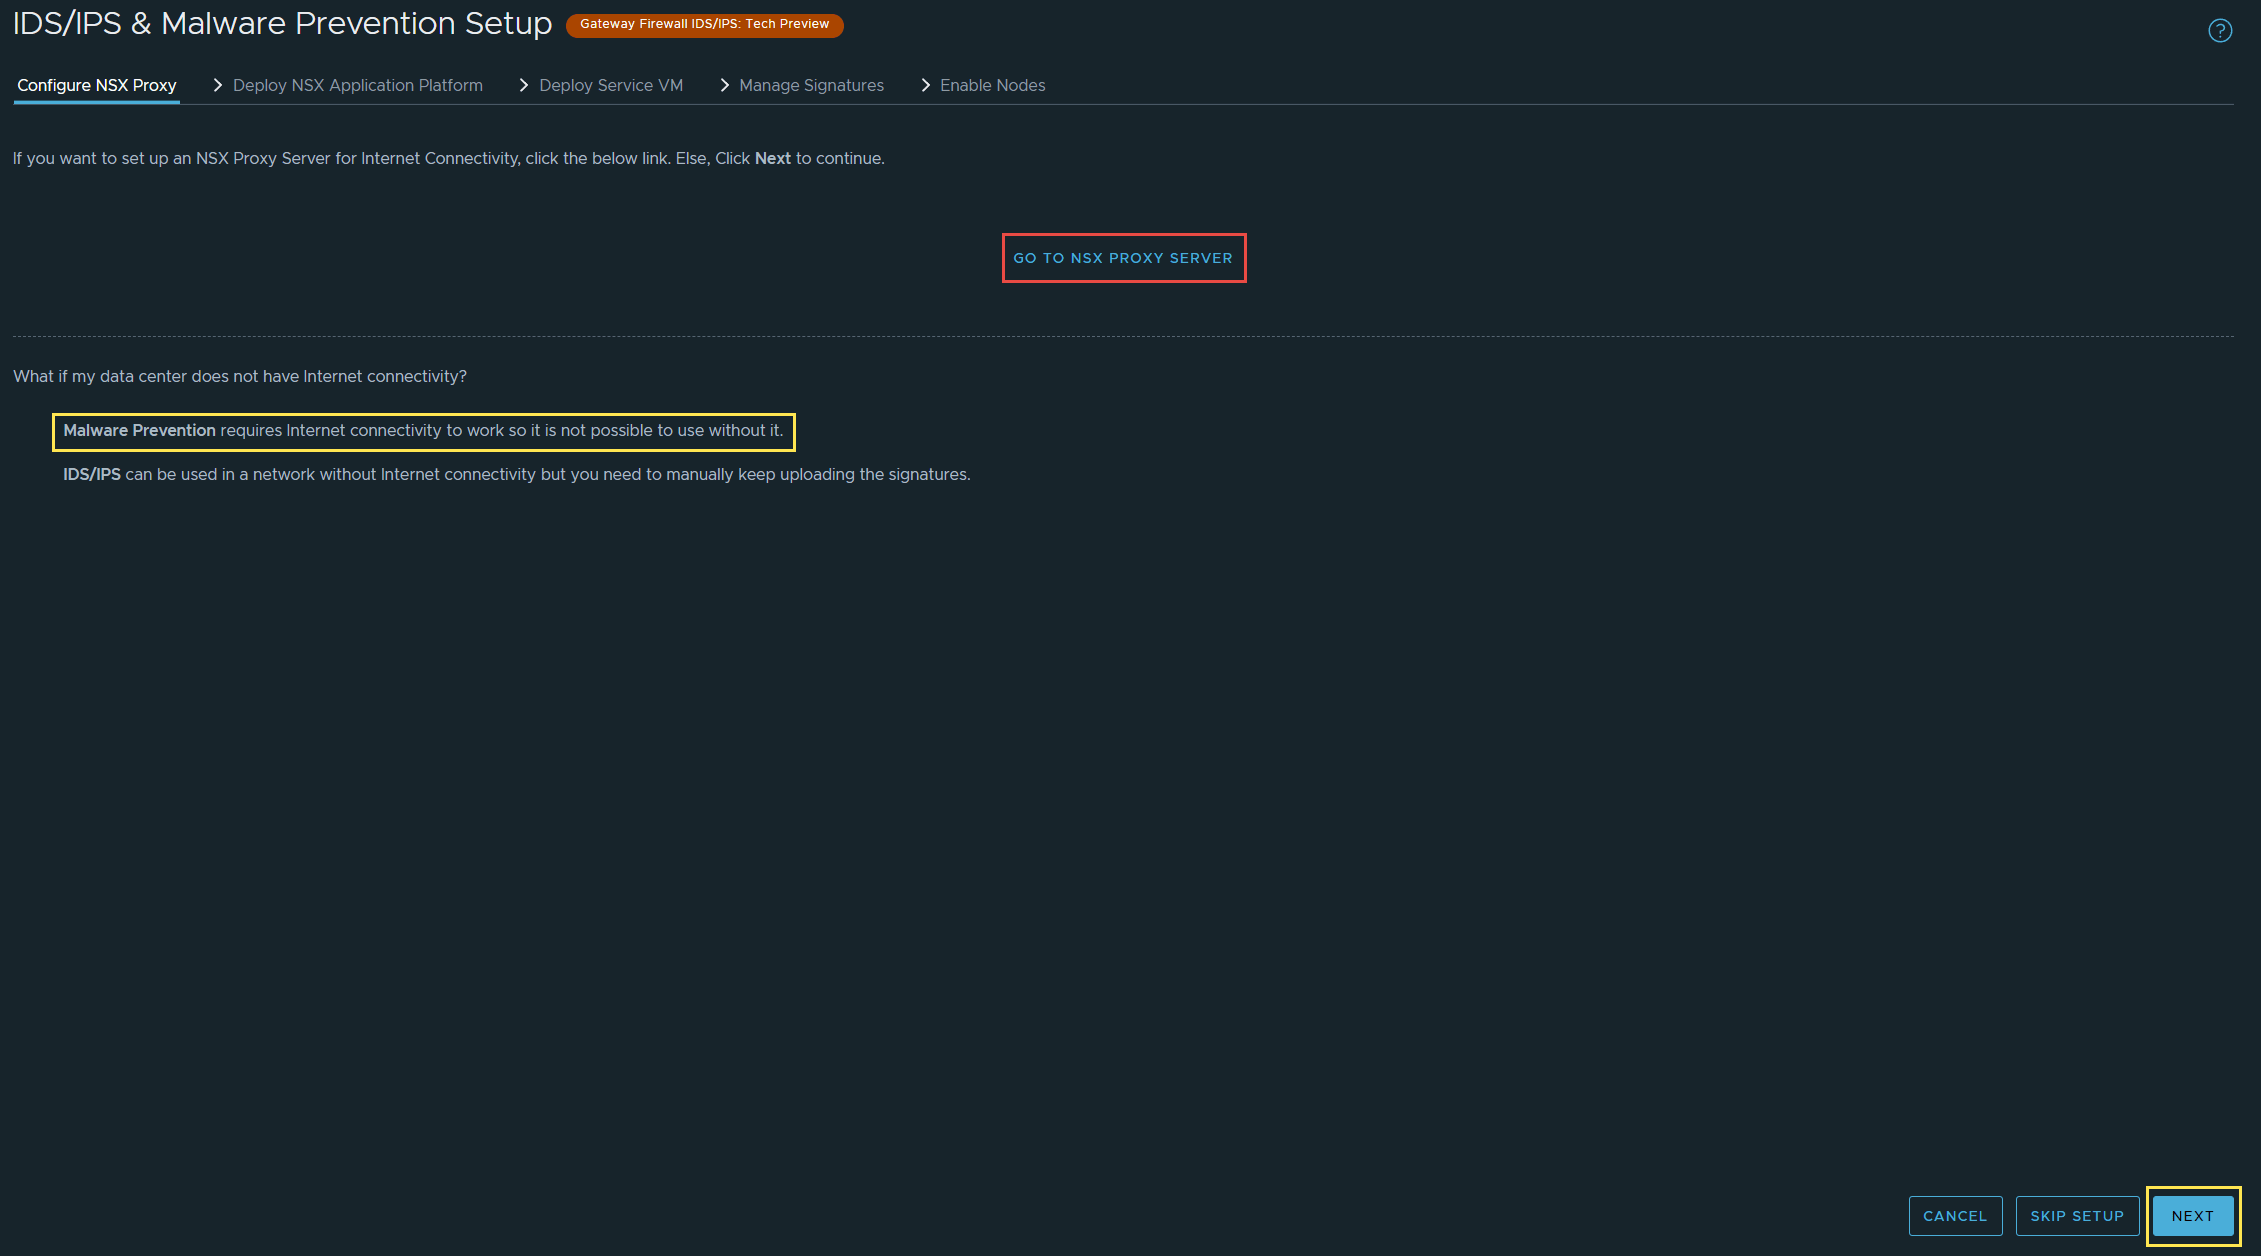
Note: As the yellow message states, Malware Prevention only works in environments with internet connectivity.
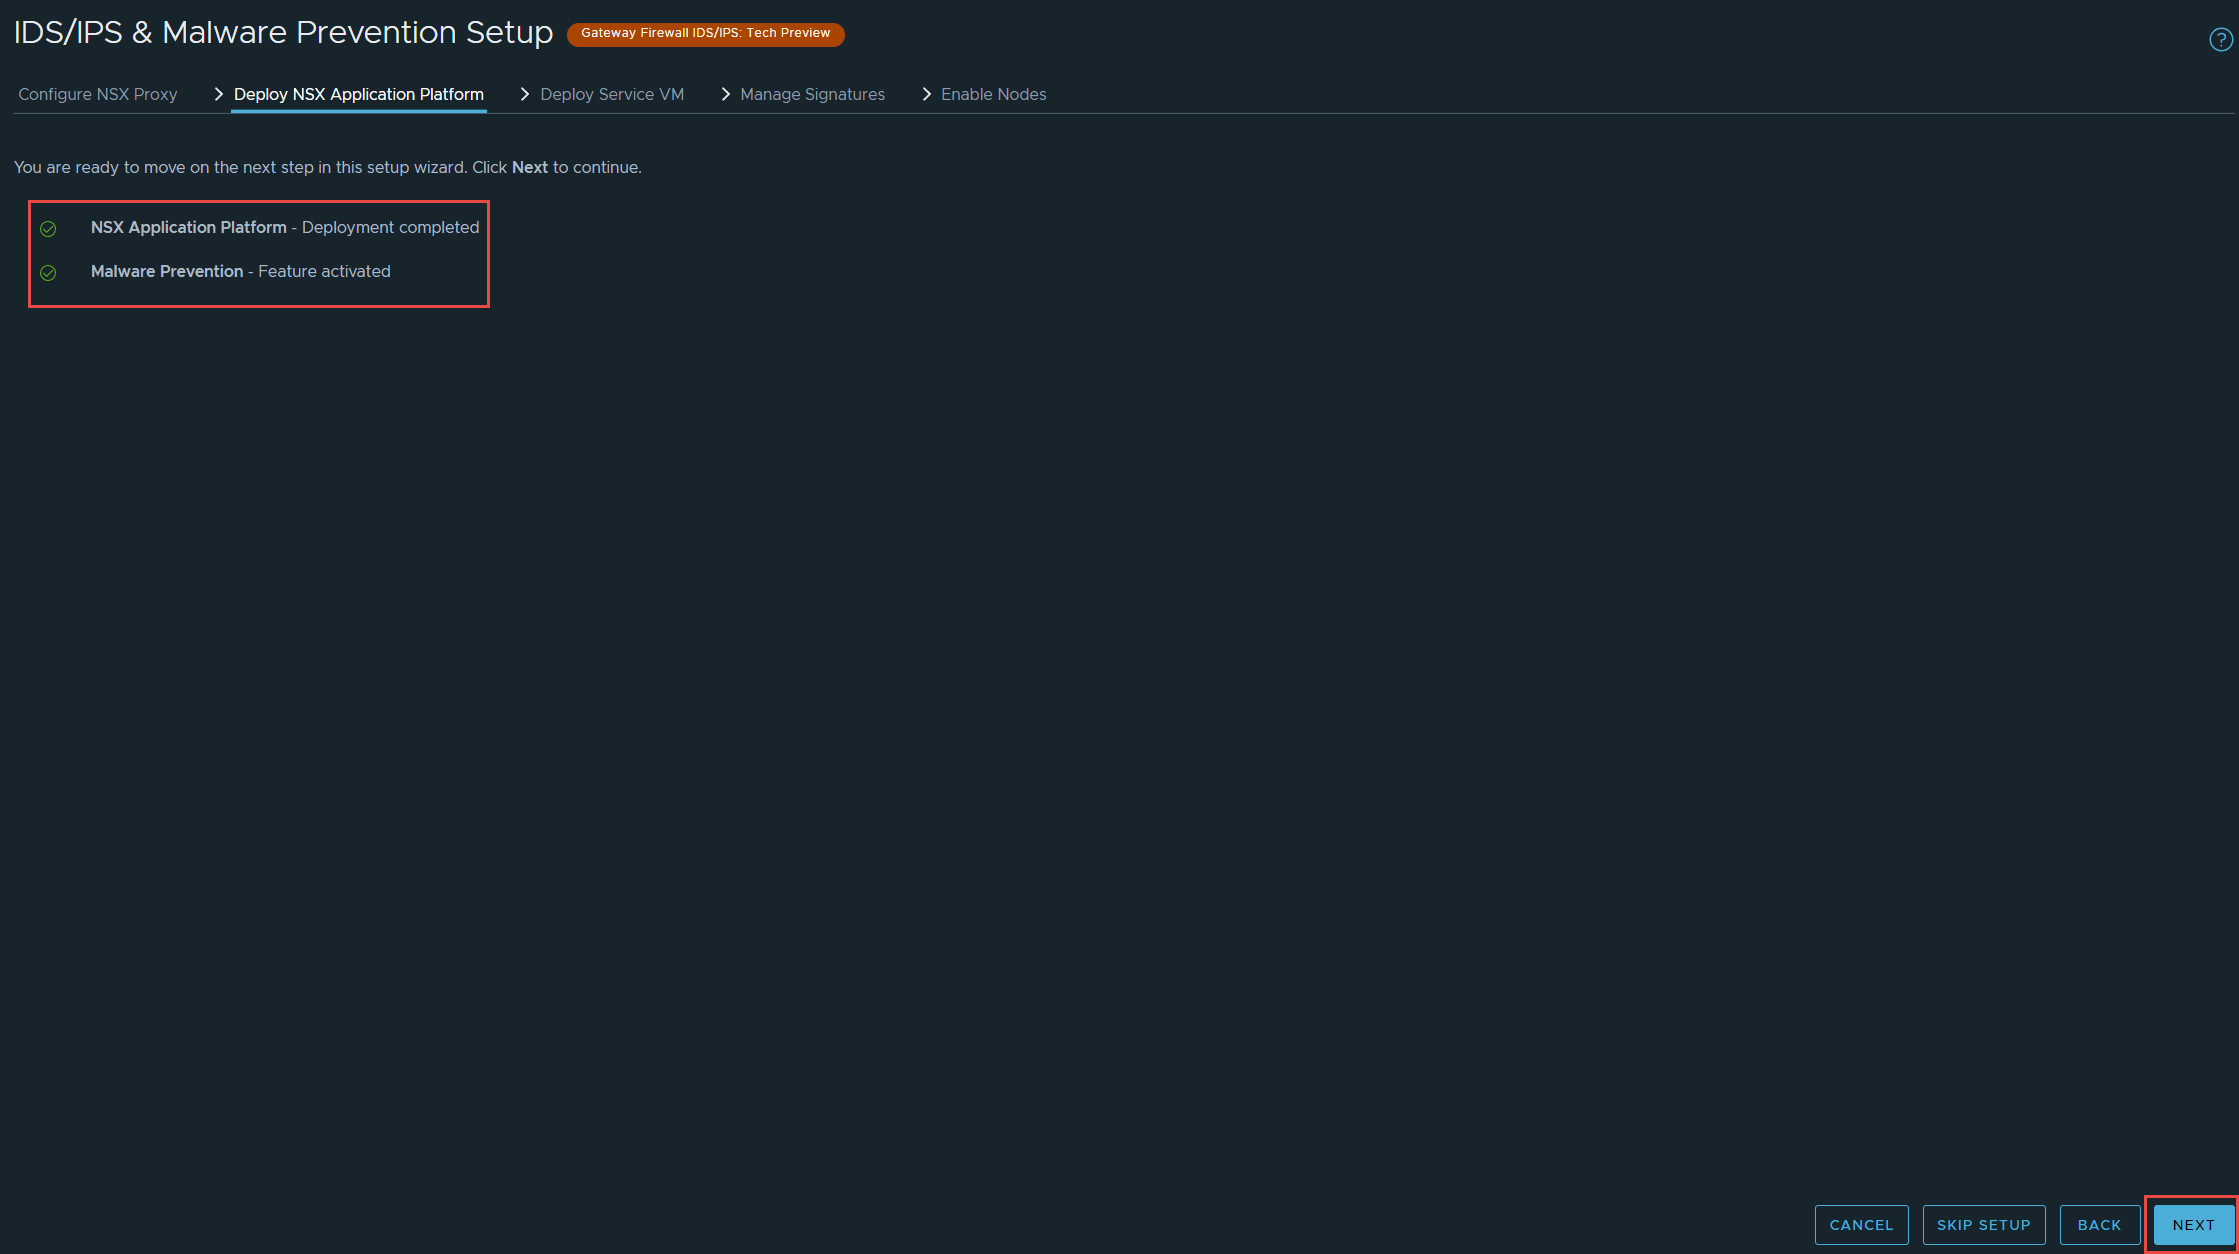
5. There is a check to ensure NAPP and Malware Prevention are configured and enabled, if they are not, it will alert you. Click Next.
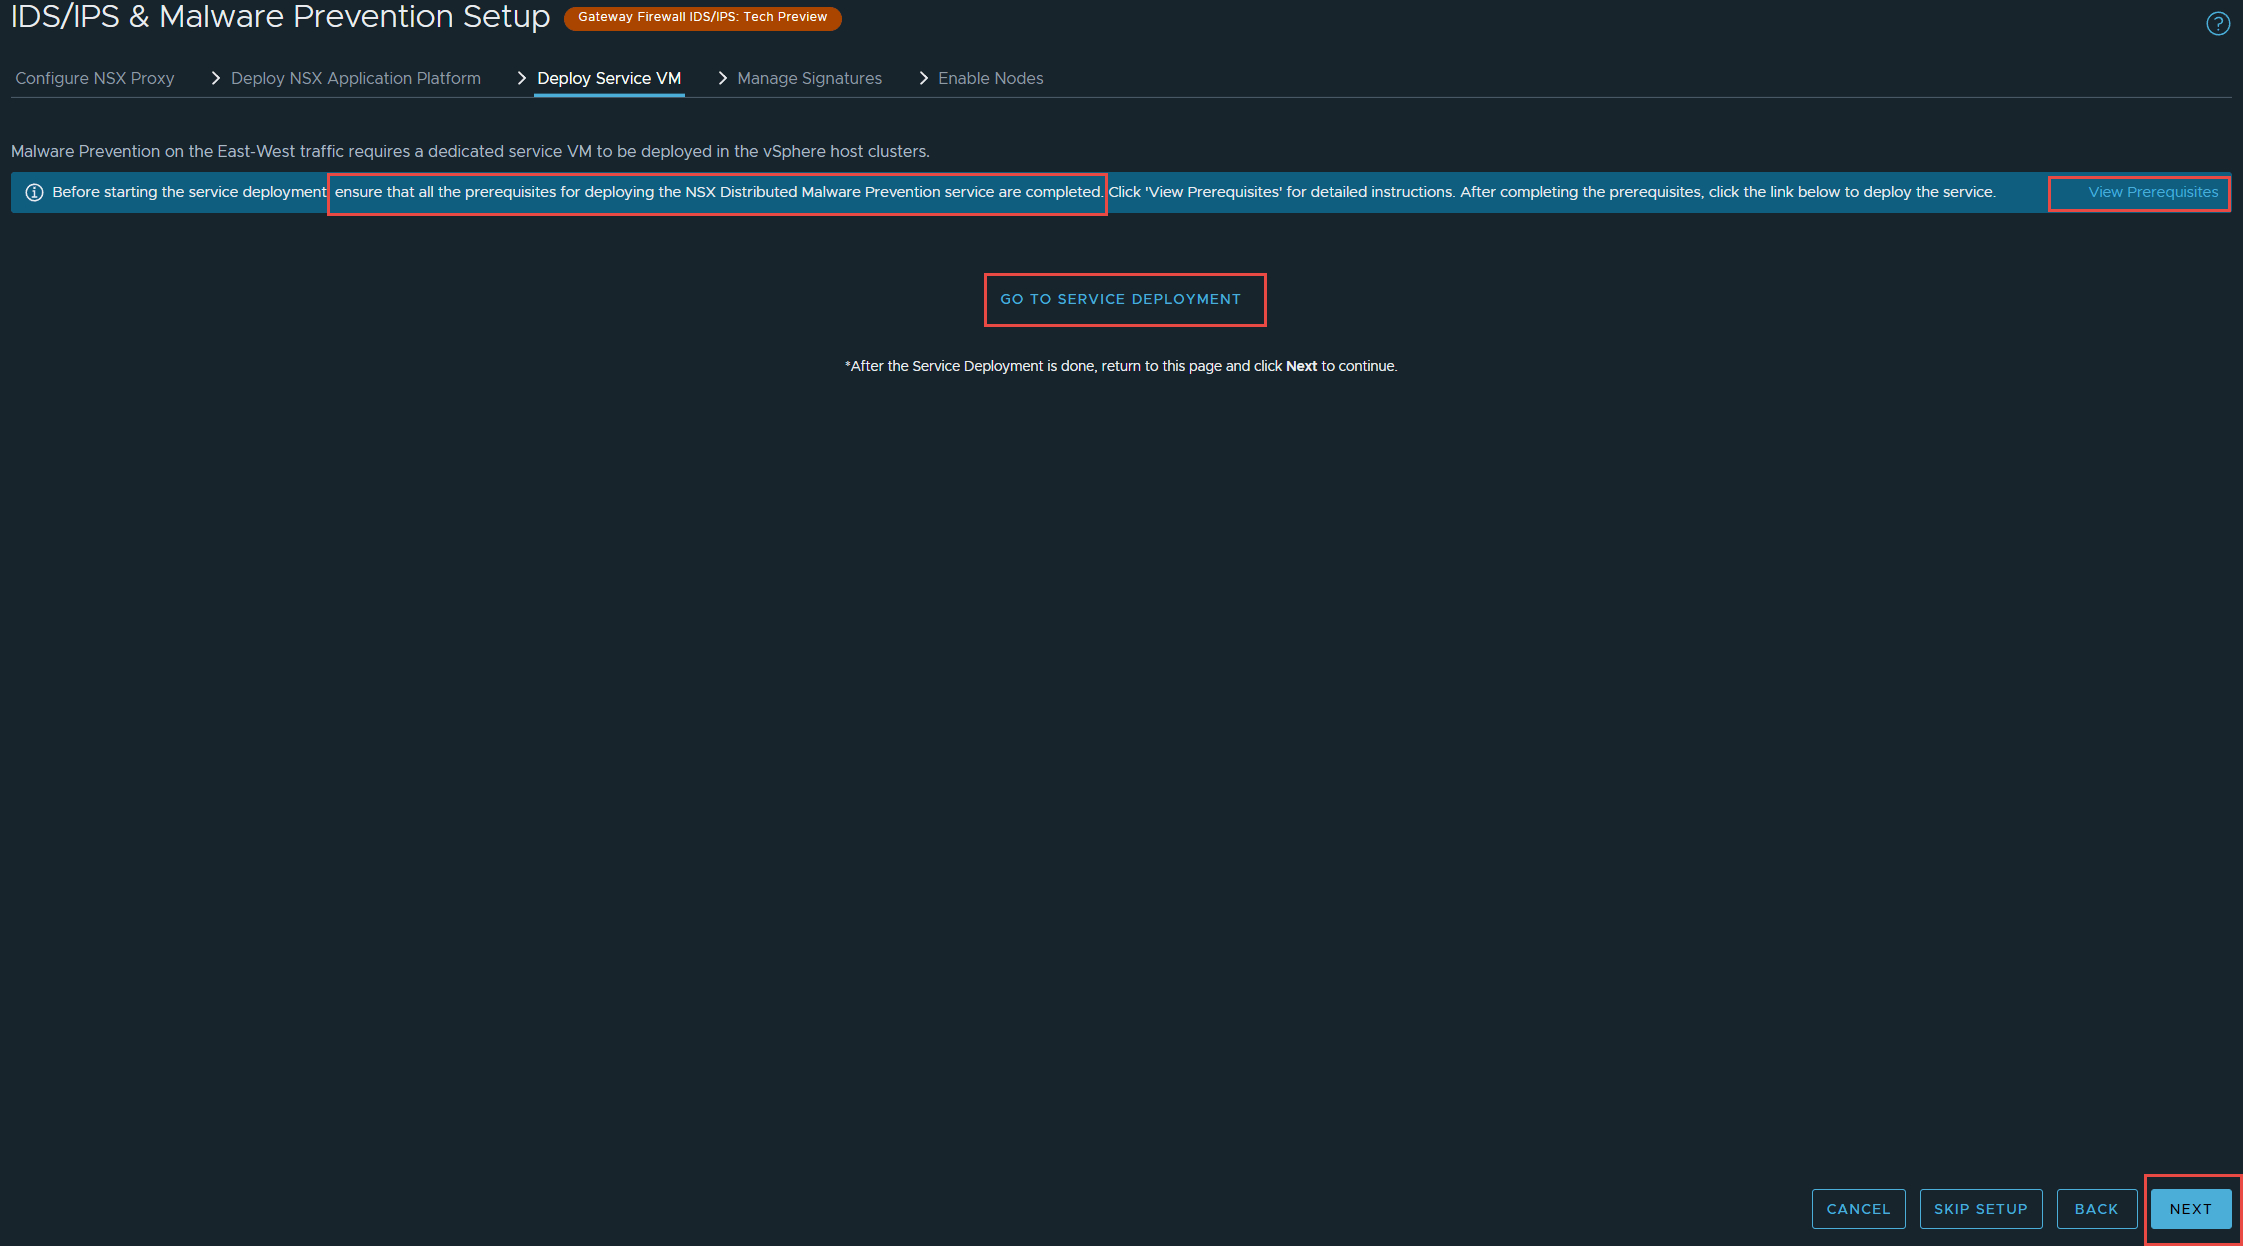
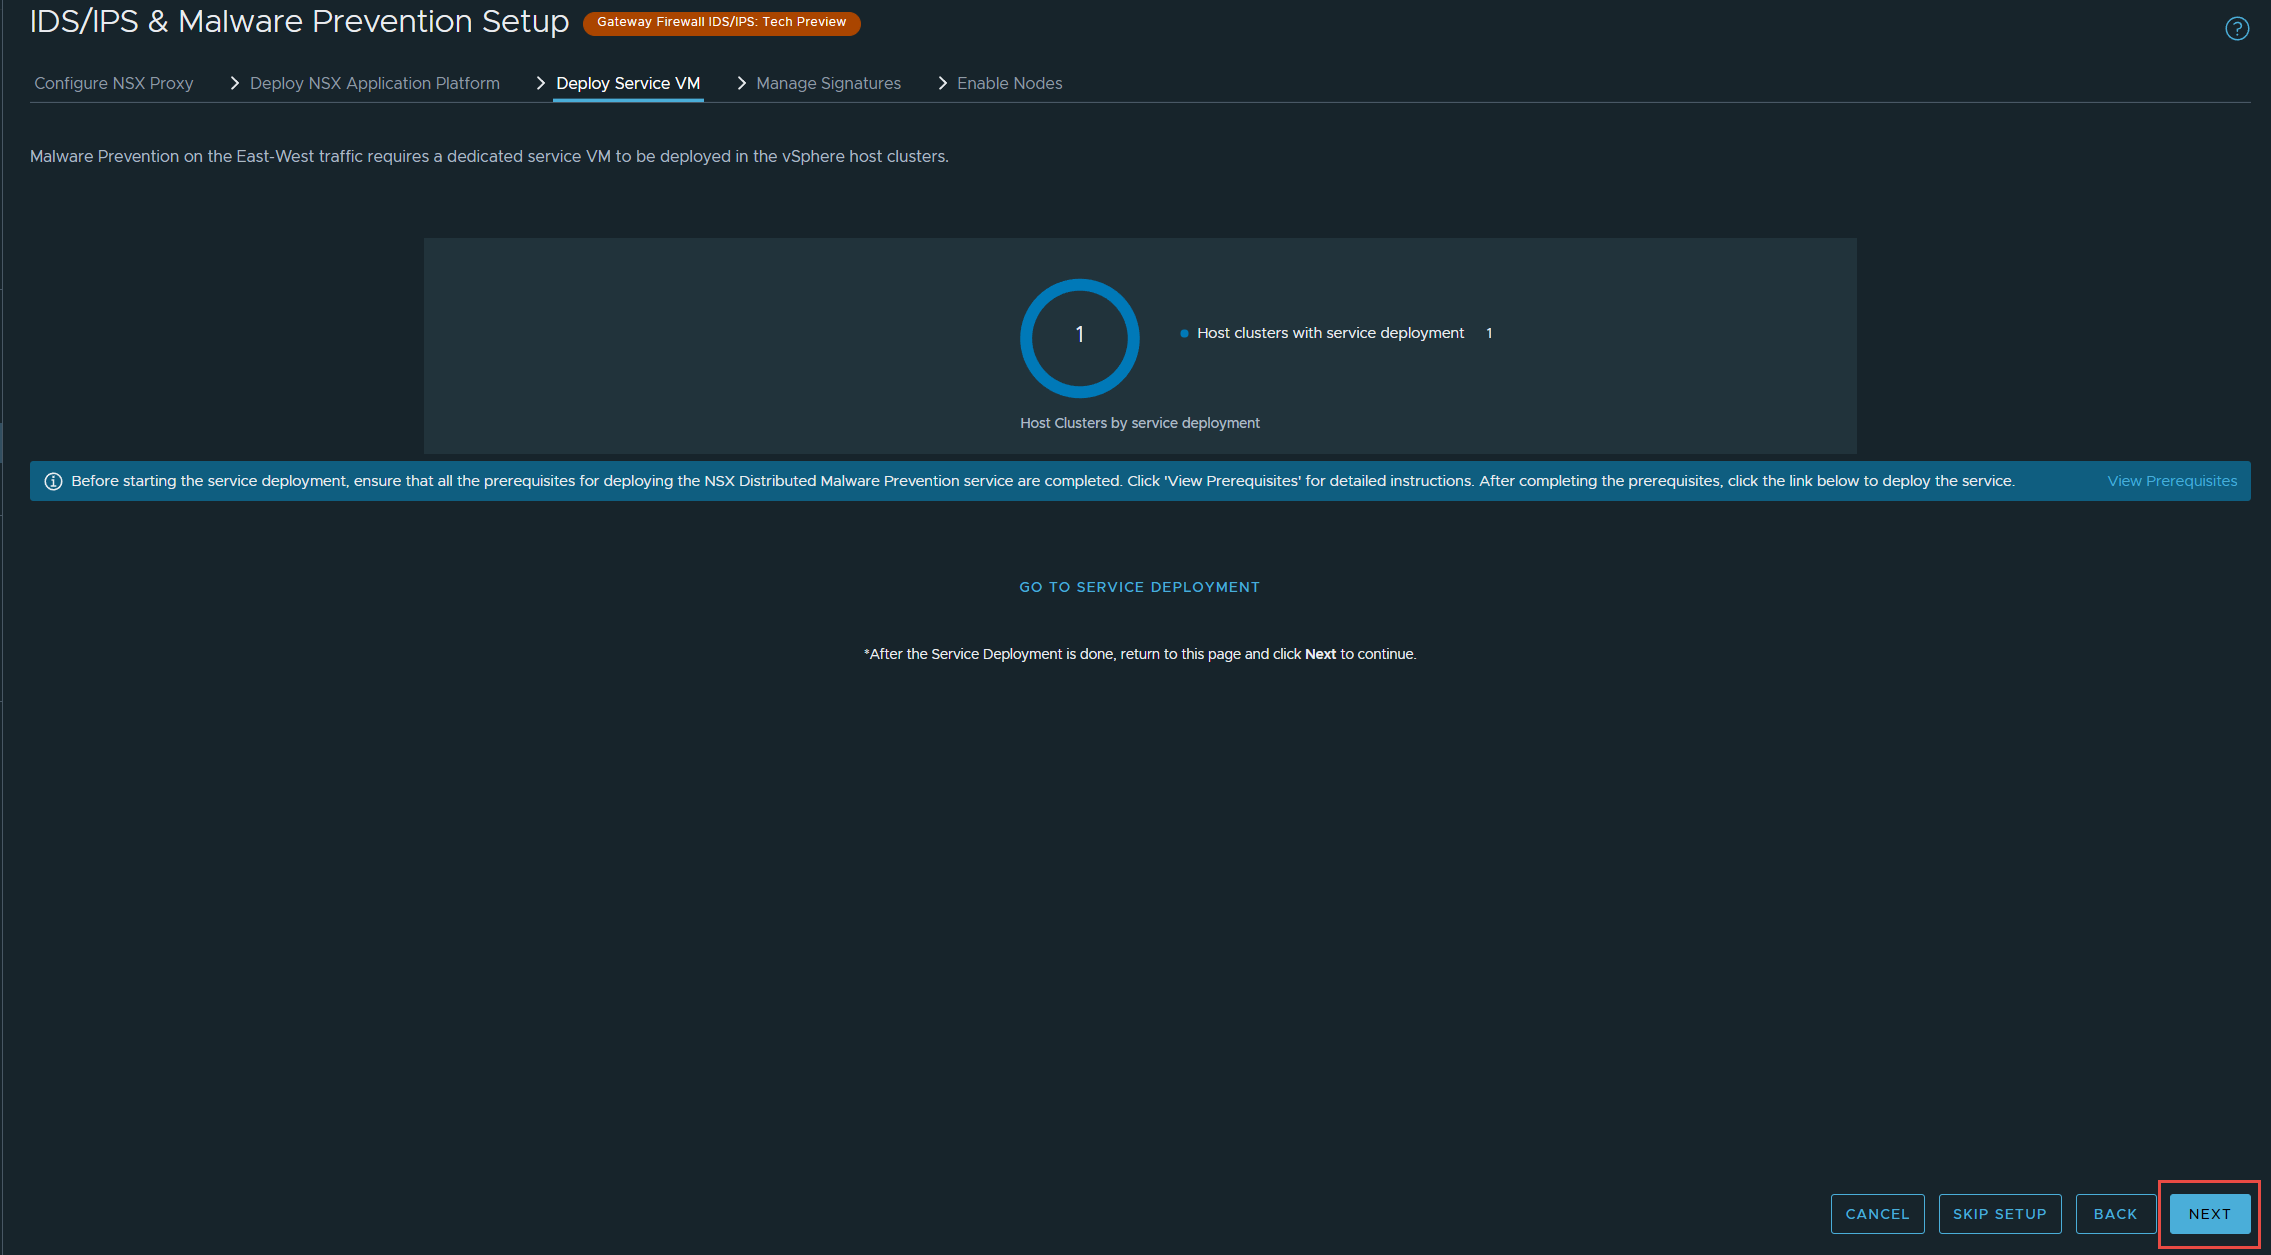
6. You are required to deploy the SVM that you downloaded before proceeding to the next step. Click on “Go To Service Deployment”. Make sure you have completed all prerequisites first.
- This link will guide you through generating a Public-Private Key pair for the SVM.
- This link will guide you through deploying a webserver for the SVM
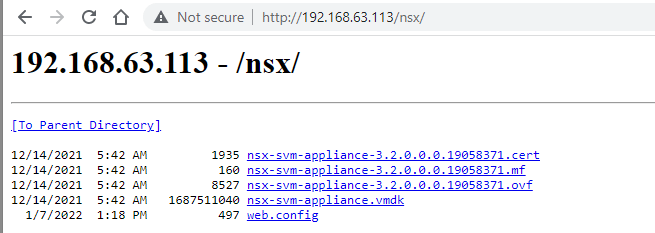
7. Now you need to register the NSX Distributed Malware Prevention Service, I will be using postman for this. My webserver is 192.168.63.113, I created a virtual directory called nsx and extracted the files from the OVA to it. Below is the result of browsing to the webserver.
The code from postman is below, make sure you use basic authentication, and enter the NSX admin username and password.
curl --location --request POST 'https://impactor.shank.com/napp/api/v1/malware-prevention/svm-spec/' \
--header 'Authorization: Basic YWRtaW46UEBzc3cwcmQxMjMh' \
--header 'Content-Type: application/json' \
--header 'Cookie: JSESSIONID=C24BD6B0380738197DBD57F0F018C9D9' \
--data-raw '{
    "ovf_url" : "http://192.168.63.113/nsx/nsx-svm-appliance-3.2.0.0.0.19058371.ovf",
    "deployment_spec_name" : "Dist_Malware",
    "svm_version" : "3.2"
}'
You should have a result similar to the image below.
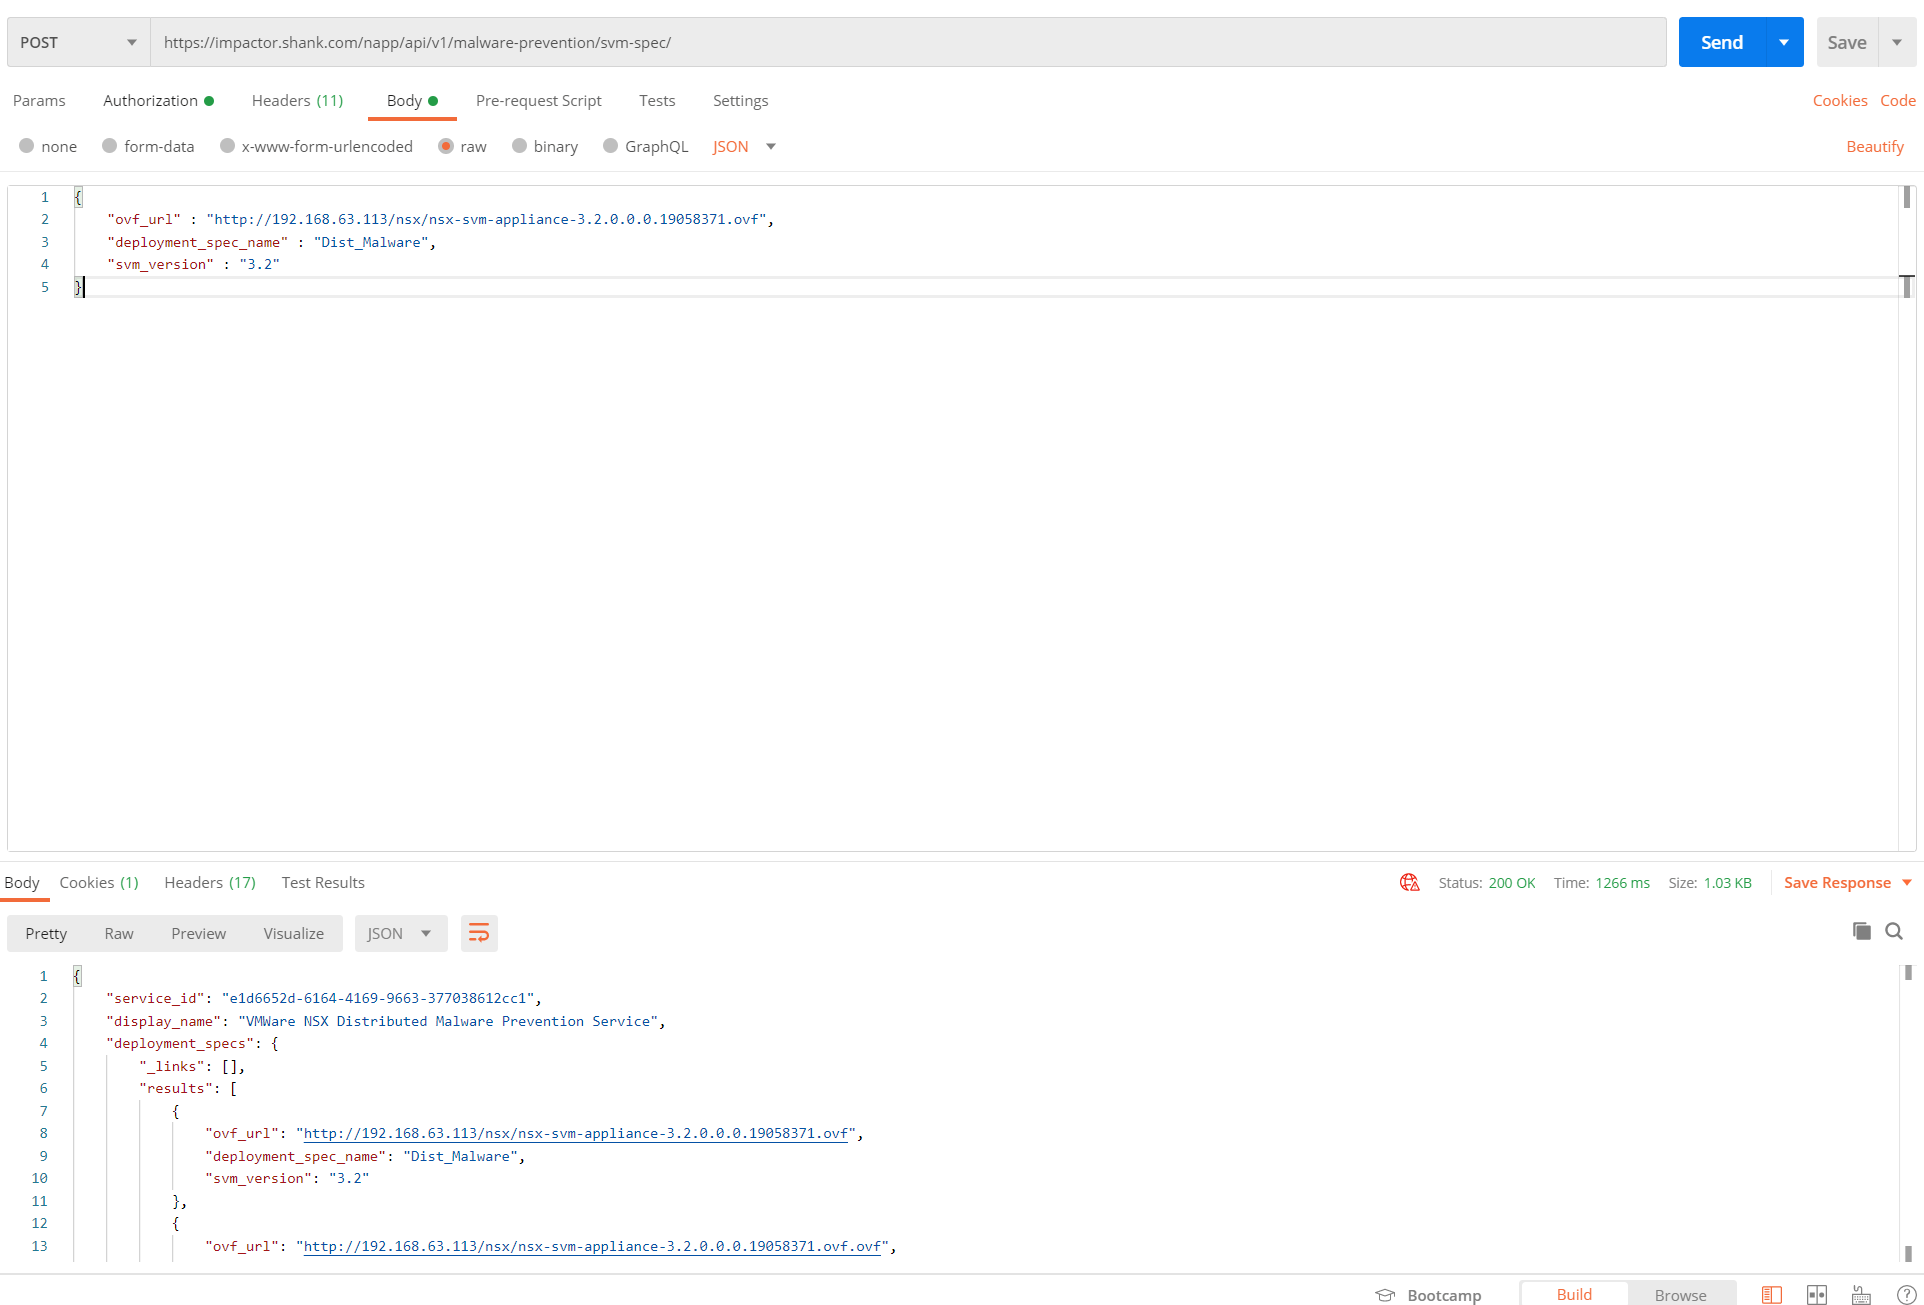
Note: If the file path is not correct in the ovf_url and you have already pushed the configuration to NSX Manager. To revert or clear the configuration, it is simplest to delete Malware Prevention and re-activate it.
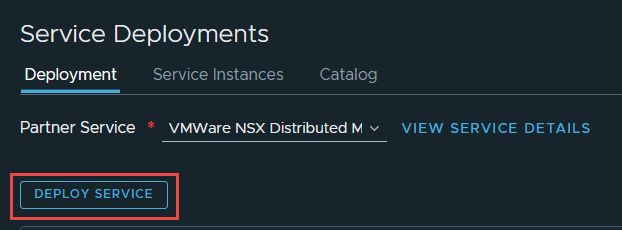
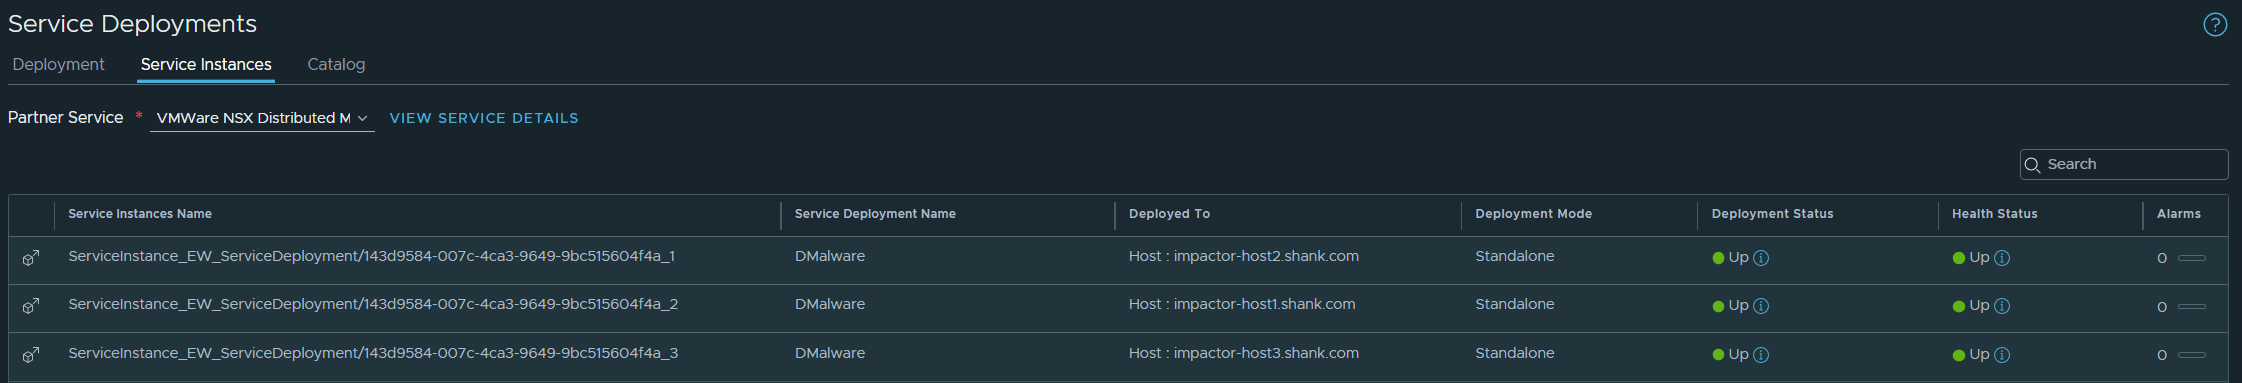
8. Navigate back to System -> Service Deployments (you may have to refresh or log out and back in), you should now see the partner service registered. Click Deploy Service.
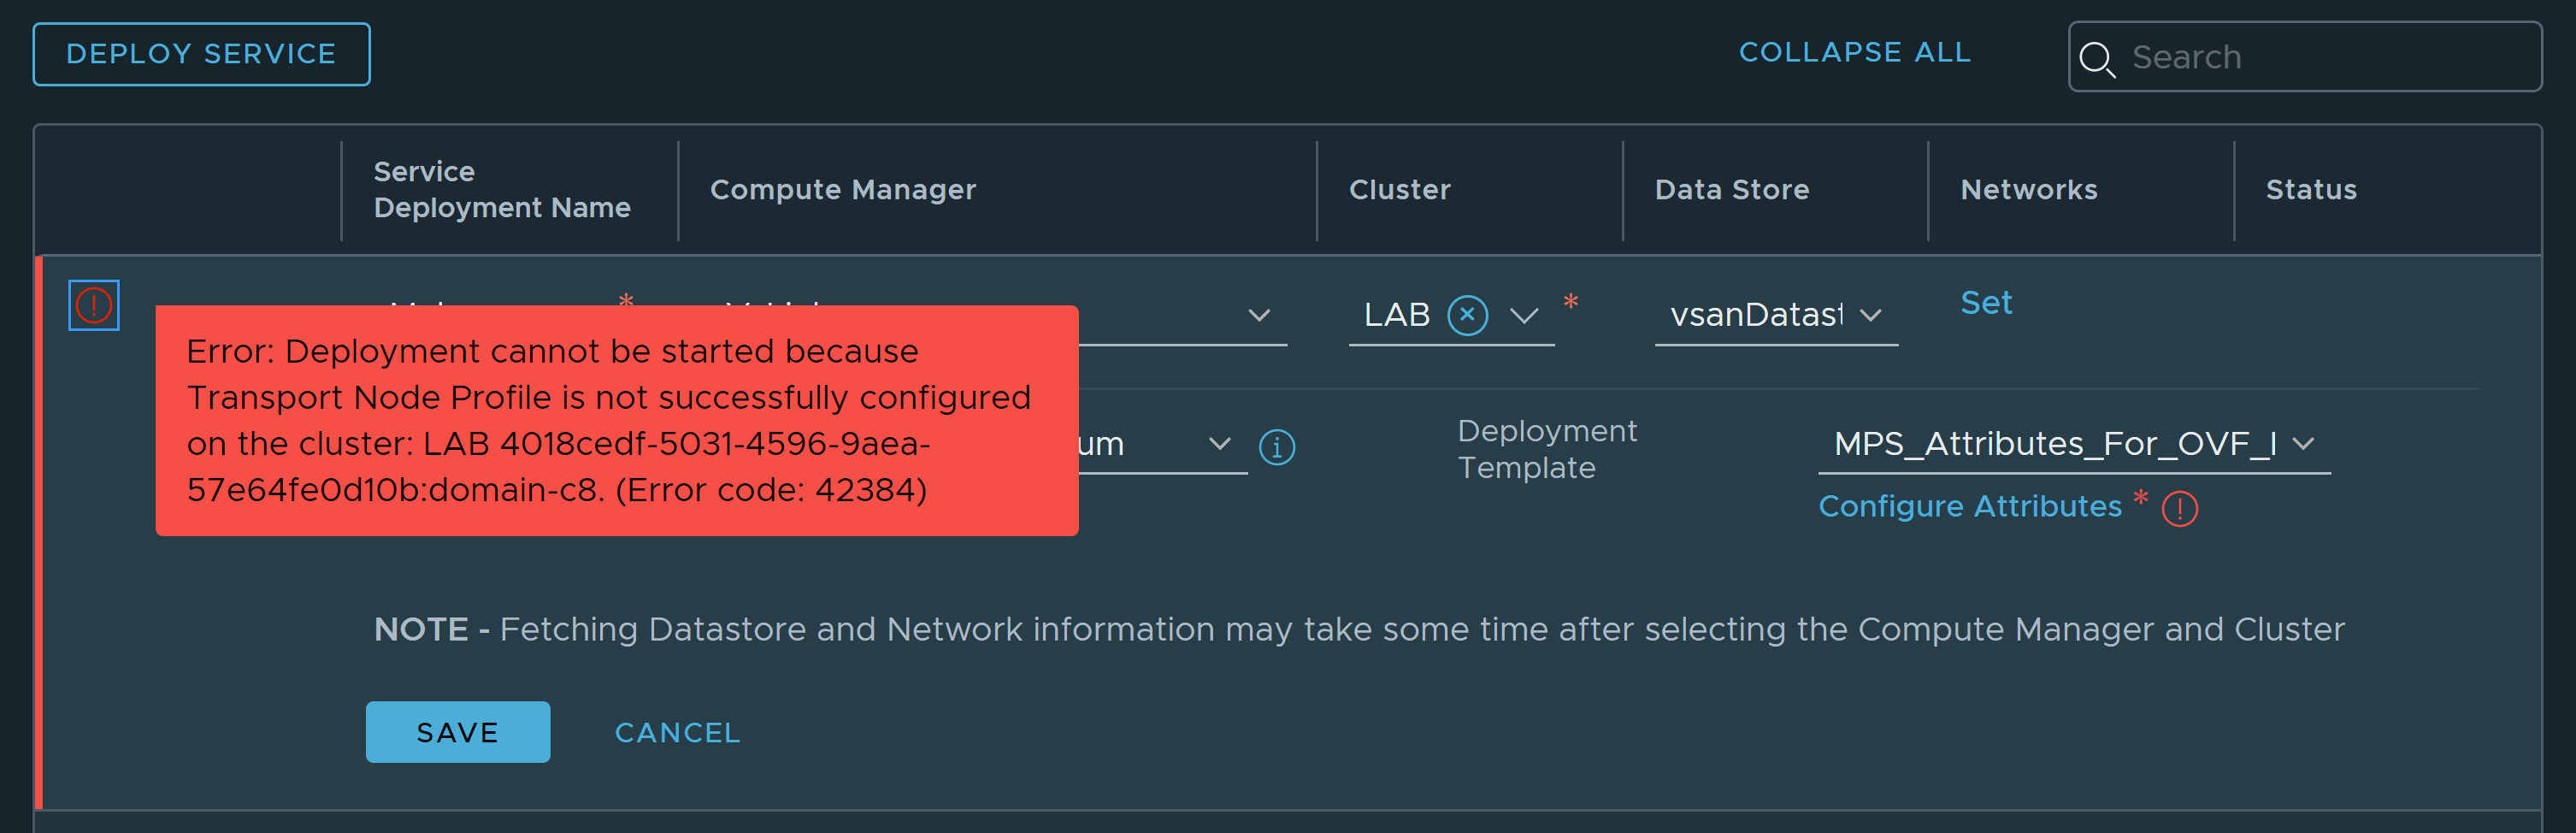
Note: You will need to have a Transport Node Profile attached to the Transport Node cluster, before you are able to deploy the SVM’s. If you don’t have a Transport Node Profile attached to the cluster, you will see the below error.
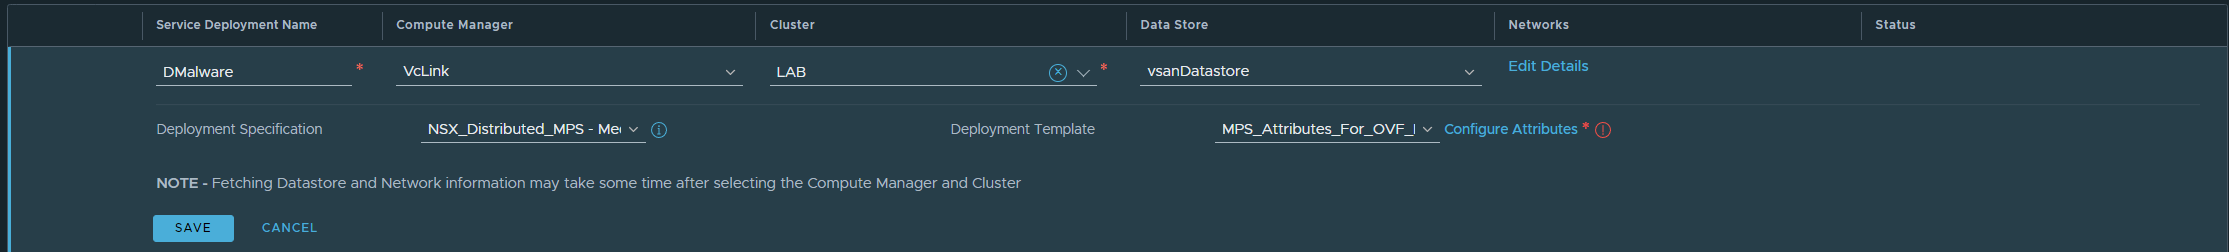
9. Fill out the details relevant to your environment in the fields below. Click Save.
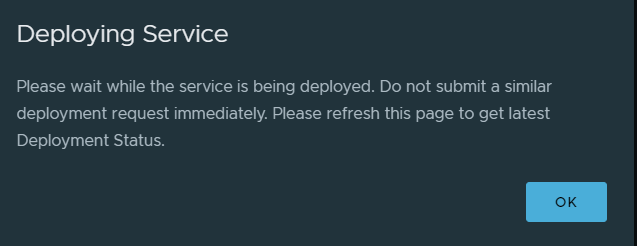
The deployment will begin.
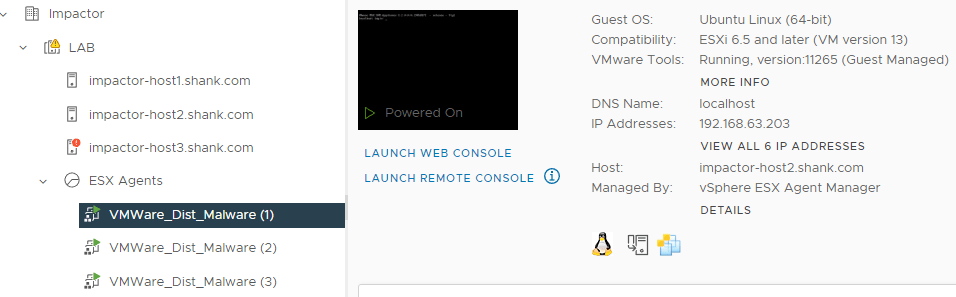
The OVF will be deployed to the designated cluster.
An agent is deployed to each hypervisor.
10. Navigate to Security -> IDS/IPS & Malware Prevention and you should be able to continue from where you were. Now that the SVM’s have been deployed, and NSX is aware of it, you should see the output below. Click Next.
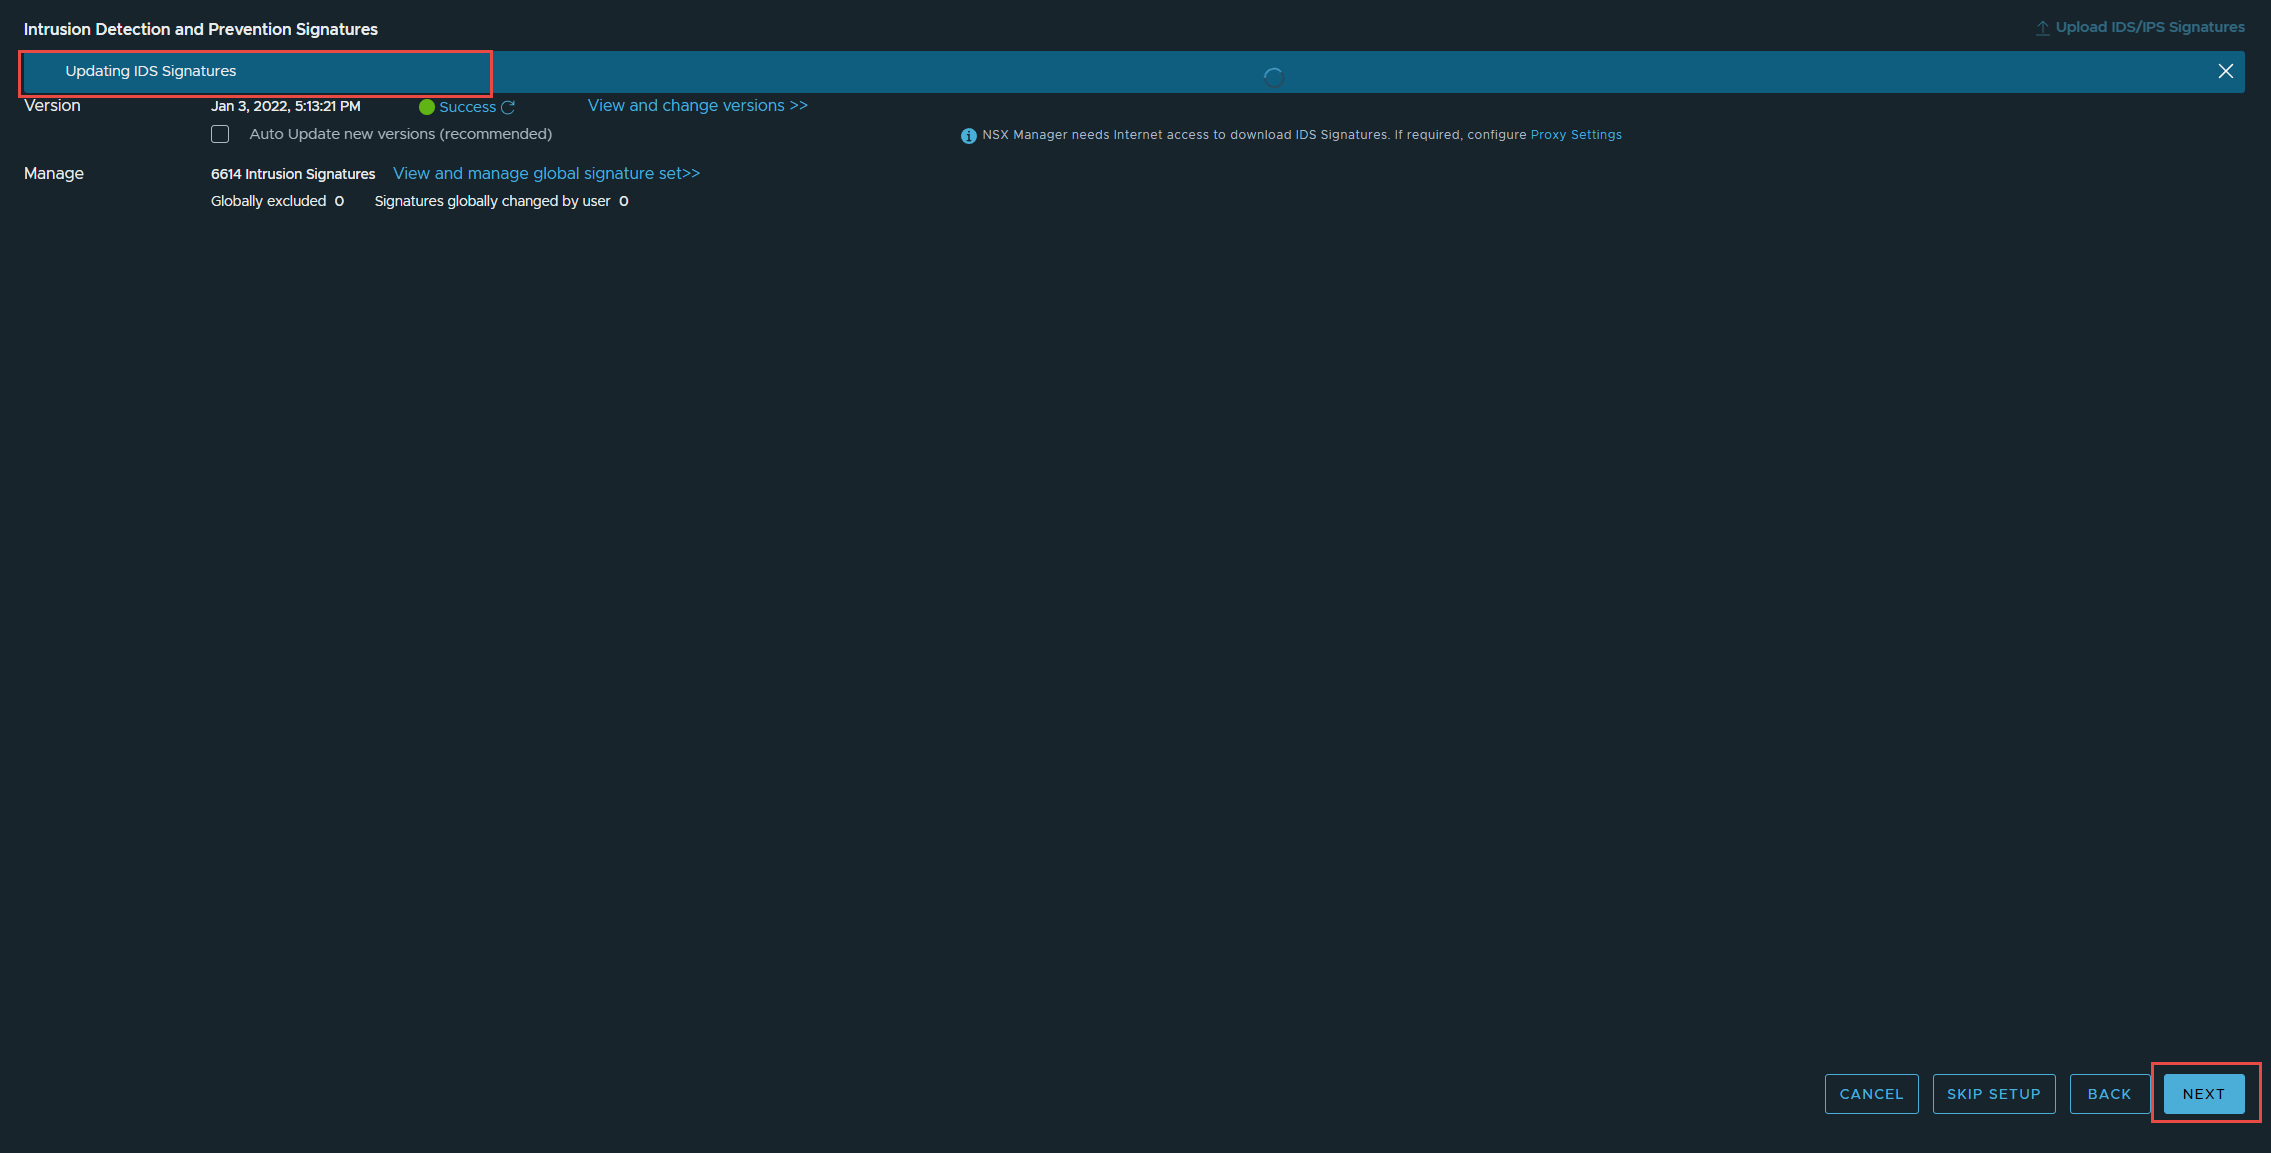
11. The next page defines the malware and IDS/IPS signatures. You can either continue, or update them if there are any updates available. I will be updating. Click Next, when done.
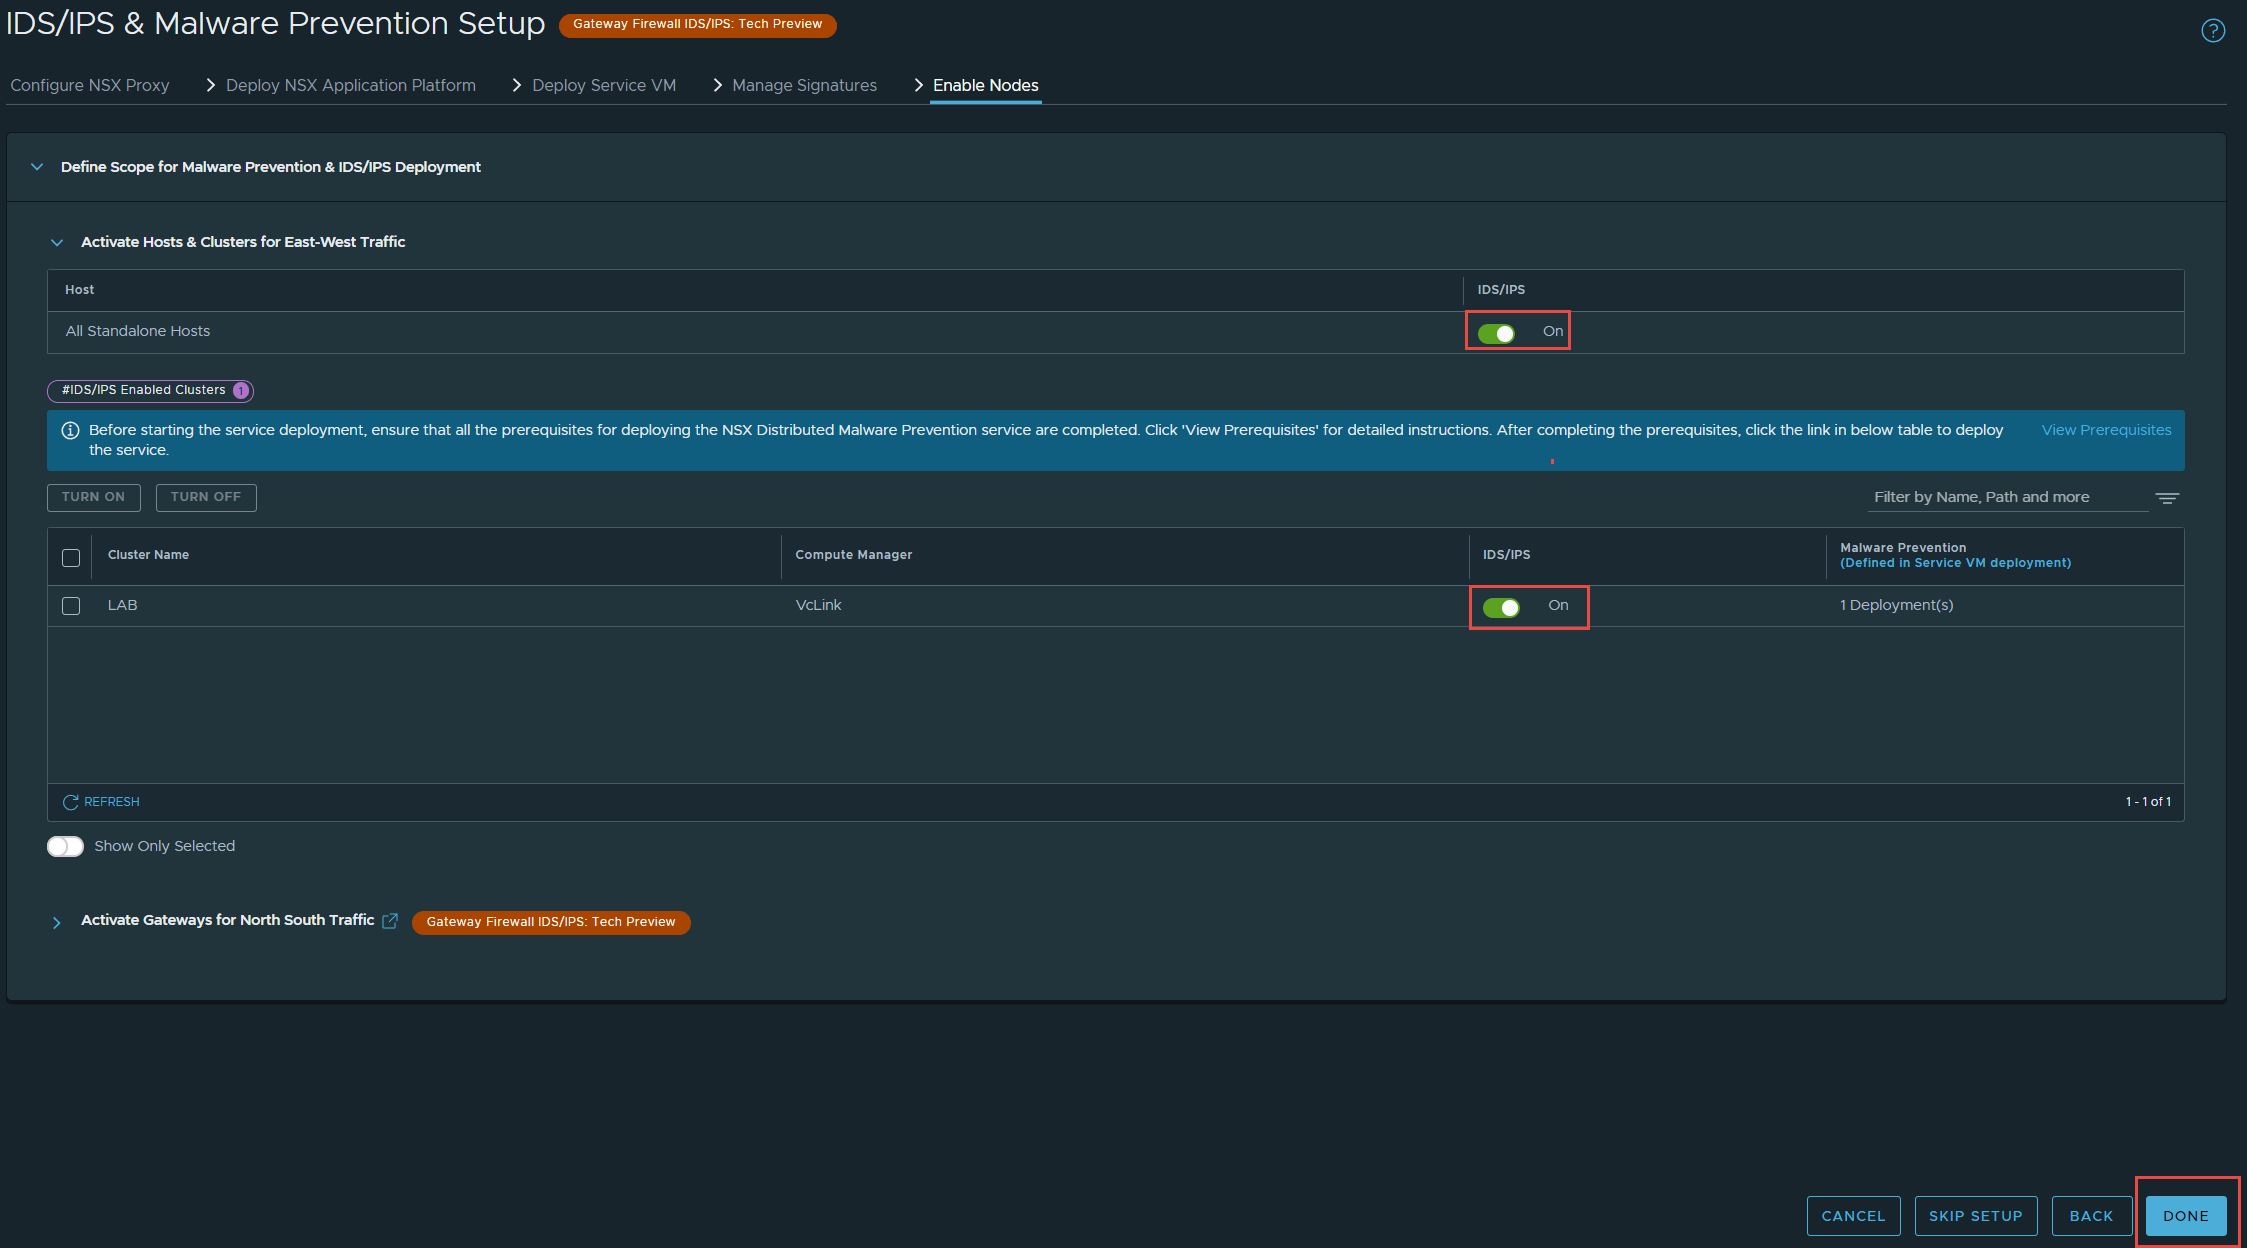
12. The final step is to enable the nodes. Click Done, when ready.
And that’s it! All the new security features have been enabled. I will go into more details of each feature in future posts.
Troubleshooting and Deployment Monitoring
Check POD Deployment
You should still be logged into the Tanzu cluster on your jumpbox from earlier, if not issue the command below.
kubectl vsphere login --server 172.51.0.2 -u [email protected] --tanzu-kubernetes-cluster-name impactorlab --tanzu-kubernetes-cluster-namespace impactor --insecure-skip-tls-verifyLets check to see the cert-manager pod deployment, issue the command below.
root@jump:~# kubectl get pods -n cert-manager
NAME                                               READY   STATUS    RESTARTS   AGE
cert-manager-769f5c8bc4-bddxh                      1/1     Running   0          83s
cert-manager-cainjector-6cd9ff7784-2cdl2           1/1     Running   0          83s
cert-manager-truststoreinjector-7c956678d6-wrbqb   1/1     Running   0          83s
cert-manager-webhook-f744b7947-zvkx9               1/1     Running   0          83s
You can check the events from the deployment using the below command, I have not included the events for brevity sake.
root@jump:~# kubectl get events -n cert-manager -wIf any of your pods are not deploying correctly, you can get further details from the pod deployment by running the below command.
root@jump:~# kubectl describe pod <podName> -n projectcontour ### or any namespace you are troubleshooting.The output from this command is quite detailed and should hopefully point you in the right direction to resolve your issue.
Project Contour Deployment
From the image below, I can see that contour has successfully deployed.
We can now check to see if the service fqdn and IP were assigned correctly. Issue the command below.
root@jump:~# kubectl get svc -n projectcontour
NAME                   TYPE           CLUSTER-IP      EXTERNAL-IP   PORT(S)                      AGE
projectcontour         ClusterIP      10.108.127.21   <none>        8001/TCP                     3m30s
projectcontour-envoy   LoadBalancer   10.110.127.98   172.51.0.6    80:30753/TCP,443:30815/TCP   3m30s
We can see an External IP of 172.51.0.6, which means the DNS record and IP address issued are correct. You can also check the events and pod status if you wish to, the command to achieve this was mentioned earlier.
Platform Deployment
This part of the deployment takes a considerable amount of time compared to the previous namespaces. To check it is still running and not suck you can issue the command below.
root@jump:~# kubectl get pods -n nsxi-platform -w
NAME                                     READY   STATUS             RESTARTS   AGE
authserver-8464fb8889-cbm49              1/1     Running            0          4m2s
cluster-api-9564dd54b-wghkb              2/2     Running            5          15m
common-agent-64445f7f95-7xsnx            0/1     Evicted            0          15m
common-agent-64445f7f95-t6wnc            0/1     Init:0/1           0          5m18s
common-agent-create-kafka-topic-mp5sd    0/1     Init:0/1           0          15m
configure-druid-bqgjf                    1/1     Running            4          15m
create-kubeapi-networkpolicy-job-tsdjq   0/1     Completed          0          15m
druid-broker-865c94fb85-cmpmz            1/1     Running            4          15m
druid-config-historical-0                0/1     CrashLoopBackOff   6          15m
druid-coordinator-7b5ff4c5b9-gvr7j       1/1     Running            0          4m41s
druid-coordinator-7b5ff4c5b9-j8kqh       0/1     Evicted            0          15m
druid-historical-0                       1/1     Running            1          5m12s
druid-historical-1                       1/1     Running            4          15m
druid-middle-manager-0                   1/1     Running            7          15m
druid-middle-manager-1                   1/1     Running            5          15m
druid-middle-manager-2                   0/1     Pending            0          6m42s
druid-overlord-74d59998cd-6ct8h          1/1     Running            5          15m
fluentd-0                                1/1     Running            0          15m
kafka-0                                  0/1     Pending            0          6m5s
kafka-1                                  1/1     Running            0          15m
kafka-2                                  1/1     Running            0          15m
metrics-server-8498c55577-hqkbc          1/1     Running            0          15m
minio-0                                  1/1     Running            0          15m
minio-1                                  1/1     Running            0          15m
minio-2                                  1/1     Running            0          15m
minio-3                                  1/1     Running            0          15m
minio-make-bucket-for-druid-bks67        0/1     Completed          2          15m
monitor-59bd4d798c-dwgrk                 1/1     Running            0          4m2s
monitor-create-kafka-topic-q6xgq         0/1     Init:0/1           0          15m
nsxi-platform-fluent-bit-7st6q           1/1     Running            0          15m
nsxi-platform-fluent-bit-ksc7p           0/1     Evicted            0          83s
nsxi-platform-fluent-bit-mqlrs           1/1     Running            0          15m
pod-cleaner-1641448800-gx6ps             0/1     Completed          0          11m
postgresql-ha-pgpool-6f4ffb6fcd-2r844    1/1     Running            2          15m
postgresql-ha-pgpool-6f4ffb6fcd-mhjtm    1/1     Running            6          15m
postgresql-ha-postgresql-0               1/1     Running            0          15m
redis-master-0                           1/1     Running            0          15m
redis-slave-0                            1/1     Running            0          15m
redis-slave-1                            1/1     Running            0          6m52s
routing-controller-7c48c7554b-vgpb4      1/1     Running            0          15m
spark-operator-5b6957767c-lzgdh          1/1     Running            0          15m
spark-operator-webhook-init-6vlx8        0/1     Completed          0          15m
telemetry-68dbc67c86-jccq7               0/1     Evicted            0          15m
telemetry-68dbc67c86-jz2vb               1/1     Running            0          6m56s
telemetry-create-kafka-topic-zlqwg       0/1     Init:0/1           0          15m
trust-manager-7975fdd76-4p274            0/1     Evicted            0          15m
trust-manager-7975fdd76-wzr9r            1/1     Running            0          6m9s
zookeeper-0                              1/1     Running            0          15m
zookeeper-1                              1/1     Running            0          15m
zookeeper-2                              1/1     Running            0          15m
druid-config-historical-0                0/1     Running            7          15m
All pods should eventually come to a running state. If you want further details about any of the pods issue the command below. Change the pod name and namespace (-n namespace) to which ever one you want more details about.
root@jump:~# kubectl describe pod nsxi-platform-fluent-bit-7st6q -n nsxi-platformThe command below will list all events for the nsxi-platform namespace, with sorted by timestamp and will tail the events.
root@jump:~# kubectl get events -n nsxi-platform --sort-by='.lastTimestamp' -wPlatform Deployment Error
You may run into the error below if you are deploying the advanced form factor.
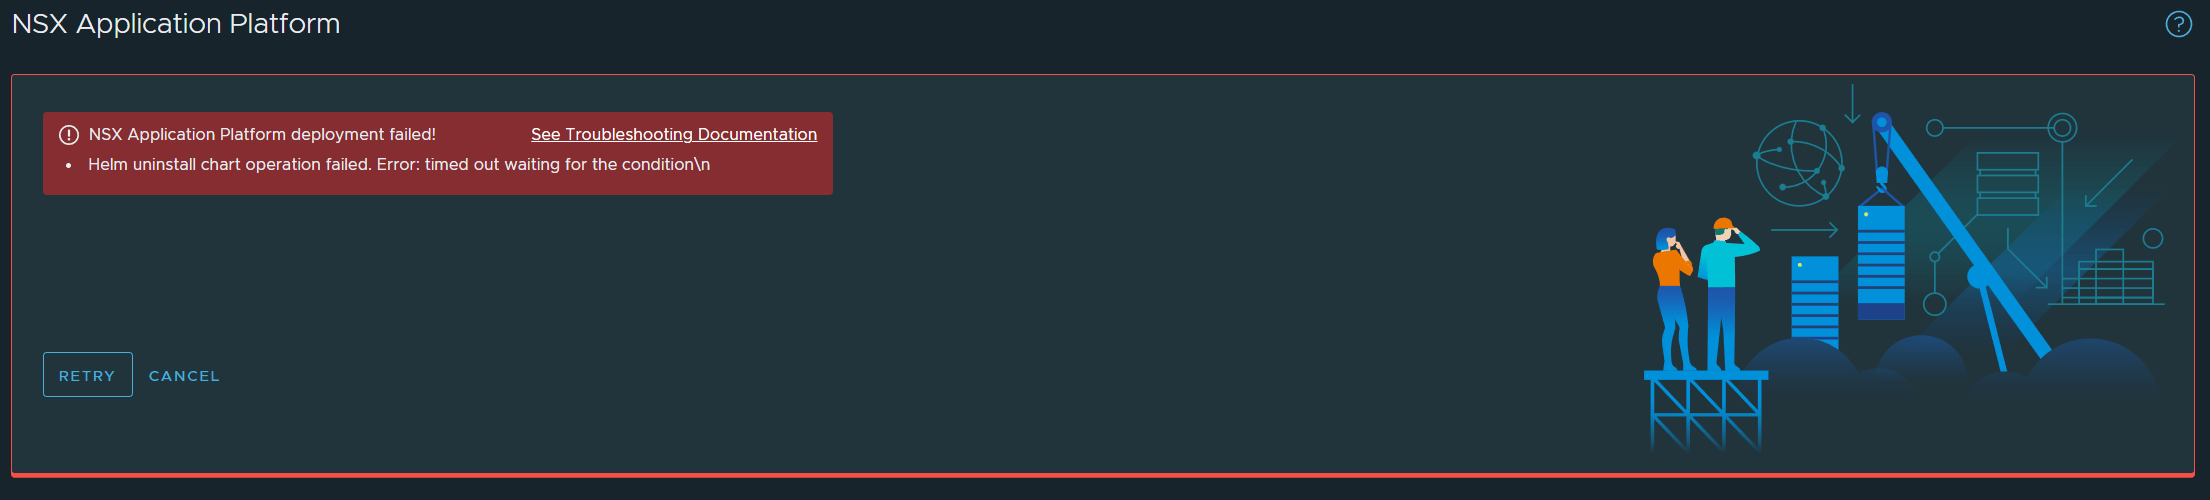
To troubleshoot check the events of the nsxi-platform namespace. You should see errors that are worded similarly to the below.
The node was low on resource: ephemeral-storage
Disk Pressure
This error is due to the lack of storage capacity on the ephemeral storage volume on the worker nodes. In my original cluster.yml, I had forgotten to set the volume size for ephemeral storage, as it requires 64GB, but without specifying it is assigned 16GB. I have now rectified the yaml file.
There are a few ways to resolve this deployment error. I am going to rollback the deployment, delete the impactor namespace in vCenter, recreate the namespace, re-deploy the impactorlab cluster using the cluster.yml file, regenerate the kubeToken and then retry the deployment. I have chosen this method as it will give me a clean slate and there was no data on the platform anyway. You may wish to achieve a similar result in a different manner. To roll back the deployment, click cancel in the failed screen above.
In vCenter navigate to Menu -> Workload Management -> Namespaces -> Select the Namespace -> Remove.
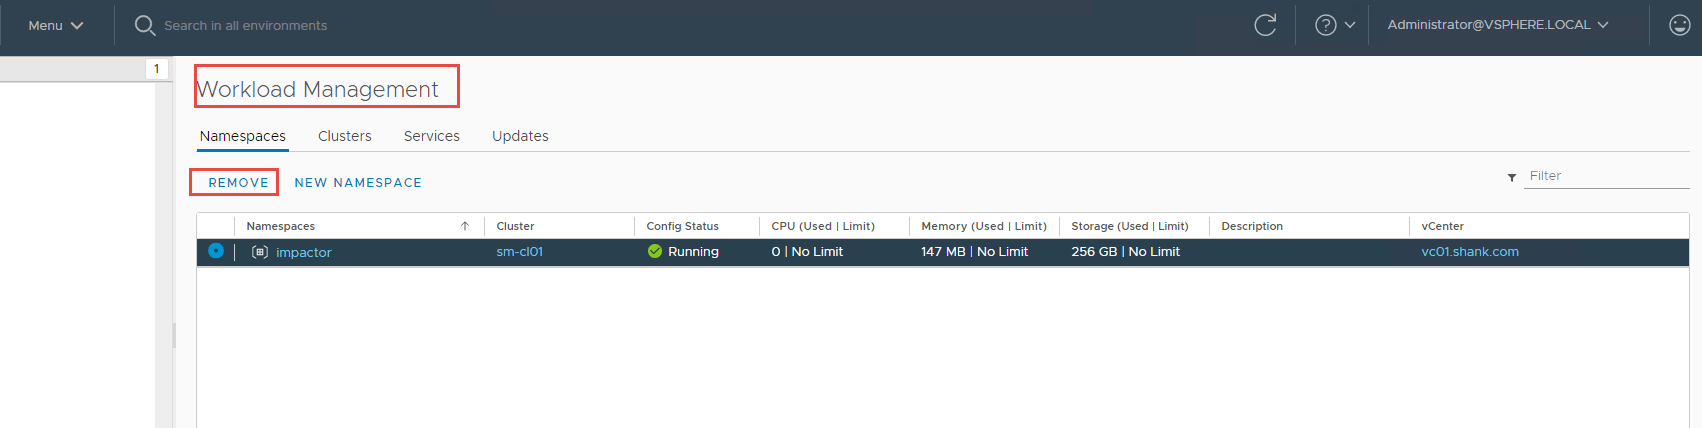
Once the namespace and nodes have been removed, you can follow the instructions in part 3 to redeploy the cluster.
Summary
This article concludes the series, and you should now have a completely functional NSX Application Platform Deployment, with all features enabled. Make sure you run through each article, as I have highlighted issues and ways I have overcome them in each.
Previous Articles
NSX Application Platform Part 1: Environment Overview
NSX Application Platform Part 2: Harbor Image Registry
NSX Application Platform Part 3: NSX-T, NSX-ALB (Avi), and Tanzu
Thank you for sharing, this SOP is very detailed instruction
I am finished the installation.
Hi Jerry,
I’m glad it worked for you and you were able to deploy the platform 🙂
I deploy NAPP call “ttps://nsxharbor.domain.com/chartrepo/nsxplatform/index.yaml: x509: certificate signed by unknown authority\n (错误代码: 46011)”.
Would you tell me how to resole this error?thankyou
Hi,
I will need a little more information on your setup, did you follow the guidance to generate a certificate in part 2 https://www.lab2prod.com.au/2022/01/napp-part2-harbor-image-registry.html?
Thanks
Hi shank, very thankfully for this lab.
i have the same problem:
“https://mydomain.domain.com/chartrepo/nsxplatform/index.yaml: x509: certificate signed by unknown authority\n (错误代码: 46011).
i have a vm on centos for repository harbor with helm, with self signed certified, my enviroment is a lab, i do not need a trusted certificate emisor.
what should i do?
you said: “You can manually trust the chain to move past this issue, ”
regards
Hi,
You can manually trust the certificate chain to move past this issue, however, you will encounter the same issue when the pods need to be deployed. NAPP currently requires a signed certificate for supportability and deployment. Do you have a domain that you could use to sign the certificate against?
Cheers
Hi shank, thks for your answer.
i have a corporate domain, with Active Directory,etc……
do i need a trusted public emisor for signed the certificate like GoDaddy, Digicert, etc??
regards!
Hi Cristhian,
Yes you will need a certificate signed by a trusted entity, like the ones you mentioned. You can also use LetsEncrypt if you wish (as I did in part 2 of this series).
Thanks
Hi, thank you for the detailed guide! It was very helpful for us. Unfortunately we encountered an error in the platform registration step.
It just says “NSX Application Platform failed to register”. All the pods are running and ready and the logs are clean. The virtual services in ALB are all up and reachable.
Do you have any ideas what could go wrong or where to look for troubleshooting?
Hey Matthias,
Did you have a look at the events to see what it mentions there? kubectl get events -n nsxi-platform.
There are also logs on the manager appliance in the NAPP folder.
Worthwhile to check those if you haven’t already. As for what could be wronkg, there are a fair few things to list, so it would be best to first check what I mentioned or comb through some of the logs / statuses more carefully.
Cheers
Hey Shank,
in the events I just see successfully completed tasks.
The logs on the NSX-T manager don’t show any errors, after the pods are all up. The only thing I could find was a request to “/napp/api/v1/platform/trust-management/certificates” which returned 503. The other thing to mention is that we are running on Tanzu Community Edition, but I don’t know if that is a factor…
I really don’t know what to check additionally…
Thank you very much for your assistance!
Regards,
Matthias
To clarify, you are hitting a 503 when navigating to System > Application Platform?
No, it happens when the manager executes registration.py and tries to get https://<>/napp/api/v1/platform/trust-management/certificates
It says SSL3 Bad Certificate…
We exported it with kubectl, as described by you and VMware.
If you wouldn’t mind, could you email me as much detail as possible? I will spend some time digesting it and try and assist. Email address can be found on the top right of this page.
Hi Shank,
First of all, thank you as always for your hard work.
I’d like to ask if you can help me for my lab , this is the setup summary :
– vcenter v7 with 3 hosts (every host has 64cpu, 256gb of memory)
– Alb with a specific cloud created for TKG
– TKGm 2.2 (standalone cluster)
– NSX 4 (only the controller installation, without any setup)
– NAPP 4
I’ve used my management network for everything
My questions :
1) For Advanced Installation of NAPP, it requires 16cpu and 64gb memory, so I have set up my worker nodes in yaml files with those resources. But I’m missing a point here, it really must have these resources on my esxi host too? Or is not a must?
2) In some configurations of NAPP that I’ve seen, they use a cluster for Management purpose (alb controller, vcenter vm, nsx controller, and tkg clusters), and another cluster to make the Host prep on NSX. Is it a must?
I’ve succesfully deployed everything, so I have my TKGm workload cluster for testing, with 1 control and 3 workers, I have NAPP installed on my NSX and I’ve installed NSX Intelligence.
The problem is : when I configure NSX on my hosts (the host – prep push), I can’t access my NAPP section anymore from NSX, I can access every other section but not NAPP, nor Intelligence, it’s always on loading like it crashes.
So my questions : is it mandatory to do nsx host-prep on another cluster, or my problem is somewhere else for your knowledge?
Thank you in advance
Valerio
Hey Valerio,
My pleasure 🙂
1) Depending on the form factor that you are deploying, the resources are required and is part of the precheck https://docs.vmware.com/en/VMware-NSX-T-Data-Center/3.2/nsx-application-platform/GUID-85CD2728-8081-45CE-9A4A-D72F49779D6A.html
2) You can have all your management appliances, as well as NAPP running on the same cluster, that’s what I do 🙂
3) To feed in relevant data you need your workload on at least VLAN backed segments, which means you need them prepped. Unless you use the vCenter plugin and sync DV PG’s, but that’s a whole other story 🙂
It sounds like something more sinister is going on, at this point you would need to check your VIPs, workload cluster and everything under the hood for NAPP, as it is likely a connectivity issue or worse yet, certain PODs may be failing.
More often than not it is networking or something environment related.
Hope this helps 🙂
Note that you MUST be on a version of NSX-T that supports oci format for the Harbor registry or NAPP deployment will fail.
Vmware has switched formats to oci. Unfortunately you will not see this in the release notes for 3.2.x. Version 3.2.3 supports oci, 4.1.x also supports oci. You cannot repoint the Harbor URL to the oci formatted one on a release that does not support oci.
Other than moving to a private Harbor repo, I can’t think of a way to workaround this.